

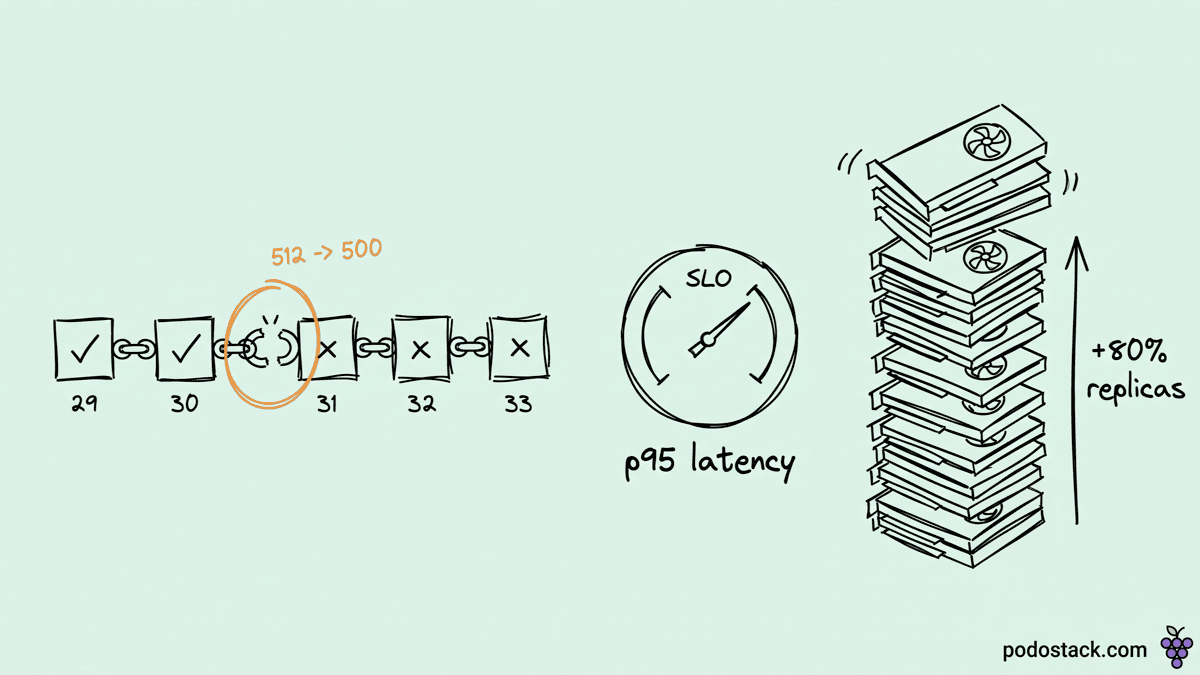
In February Nick Roan published a short post-mortem on Medium about a pull request that broke nothing. His team changed RAG chunking from 512 tokens to 500 to fit a downstream context budget. Answers stayed accurate and the unit tests passed. The prefix cache hit rate went from about 85% to about 4%, and in his words: "On the same traffic volume, GPU replicas increased 80% while p95 latency remained within SLO."
Those numbers are his. The post doesn't name the autoscaler or its scaling signal and gives no timeline after the merge, so the dashboard below is a reconstruction.
The graph with nothing red on it
Illustrative values shaped to his numbers, two GPUs per replica, flat traffic:
$ ./slo-cost-report.sh --around merge --step 12h
# illustrative, shaped to the public write-up: hit rate 85% -> 4%, replicas +80%
# SLO: ttft_p95 < 1s
window   prefix_hit  ttft_p95  replicas  req_s  gpu_s_per_1k_req
T-48h    0.86        0.41s     10        31.8   629
T-24h    0.85        0.43s     10        32.4   617
T-12h    0.85        0.40s     10        31.5   635
T+0h     0.31        0.97s     11        32.0   688
T+12h    0.05        0.63s     16        31.9   1003
T+24h    0.04        0.55s     18        32.2   1118
T+48h    0.04        0.56s     18        31.6   1139
TTFT spikes for one window and settles under the line. An HPA does what its formula says: desired replicas equal current replicas times current metric over target, rounded up. GKE's guide for LLM inference recommends queue size or batch size as that metric, and a queue grows the same way whether traffic doubled or every request got several times more expensive to prefill. Replicas climbed until the queue drained. Two columns stayed up after that, replicas and GPU-seconds per thousand requests, and neither one is a latency SLO.
Links
Why twelve tokens stranded everything behind them
vLLM keeps the KV cache in 16-token blocks by default and caches only full ones. Per the prefix caching design doc, each block's hash covers its own token IDs plus the hash of the block before it, so one hash fingerprints the whole prompt up to that point. The full-attention lookup in vllm/v1/core/single_type_kv_cache_manager.py walks the chain from the start and breaks on the first miss. A comment above that loop reads: "A missing block implies every later block misses too (chained hashes)."
Roan's post walks the blocks. Everything through token 495 matched, 31 blocks of it. Block 31 held the first token the new chunking changed, and each block after it carried text the cache had seen before under a parent hash it had never seen, so none of them hit.
SGLang's RadixAttention keeps the cache in a radix tree keyed by token sequences, with LRU eviction, instead of a table of hashed blocks. It is still a prefix structure, and a divergence near token 500 orphans everything beneath that node the same way. A date string at the top of a system prompt does it from block zero.
The honest part: a boundary shift alone should heal. I copied vLLM's block hashing and first-miss lookup into a Python replay and fed it 3,000 RAG prompts over 100 document-topic groups. Right after the switch to 500 the token hit rate fell to 53% for 100 requests, then ran at 97% for the remaining 2,900 while new prefixes warmed. A rate that stays near 4% needs a prefix that changes on nearly every request. The post doesn't say what did that. My guess is retrieval re-run every turn and placed ahead of the conversation history.
Links
What the alert looks at now
Roan's fix lives in CI. An ephemeral vLLM container on a T4 or A10G runner replays about 50 multi-turn conversations twice, warm-up then audit, and fails the build when hit rate drops or recomputed tokens rise against a baseline from main. Tokenizer and model revisions are pinned, and hashing runs with sha256_cbor, since the default sha256 serializes through pickle and may not reproduce across Python or vLLM versions.
One detail the post gets loose: it calls the hit rate "request-level", but vllm/v1/metrics/stats.py counts both queries and hits in tokens. If his formula reads those counters, 85% meant 85% of prompt tokens came from cache. The old V0 gauge vllm:gpu_prefix_cache_hit_rate is gone, and the V1 counters dropped their gpu_ prefix in v0.10.0. On v0.29.0, released September 9, three queries cover it:
# token-weighted prefix cache hit rate
sum(rate(vllm:prefix_cache_hits_total[15m]))
  / sum(rate(vllm:prefix_cache_queries_total[15m]))

# prompt tokens computed per request, cache hits excluded (v0.13+)
sum(rate(vllm:request_prefill_kv_computed_tokens_sum[15m]))
  / sum(rate(vllm:request_prefill_kv_computed_tokens_count[15m]))

# GPU-seconds per 1k requests
1000 * sum(
  kube_pod_container_resource_requests{namespace="llm", resource="nvidia_com_gpu"}
  * on (namespace, pod) group_left () (kube_pod_status_phase{phase="Running"} == 1)
) / sum(rate(vllm:request_success_total{namespace="llm"}[15m]))
The middle one also catches a prompt that doubled in length at a steady hit rate, the case Roan's second gate was built for. Nothing in the GPU-seconds query cares how many replicas the autoscaler considers fine.
Links
More replicas, fewer hits
The cache lives in each replica's GPU memory unless a KV connector shares it, so going from 10 pods to 18 behind a plain Service, as in the table above, means every hot prefix gets prefilled once per pod before it hits. In the same toy replay, 300 requests against cold pods reached 74% on one pod, 58% on two, 42% on four and 31% on eight. Steady state closes most of that gap when KV memory is big enough, but scale-out pods start cold and show up while the fleet is already short.
llm-d measured the real version with Qwen3-32B on 8 vLLM servers across 16 H100s, using 150 prefix groups that each open with a 6,000-token system prompt. Behind a stock Service TTFT p90 reached 135.5 s at the top of the rate ladder, while the llm-d router held it under 0.3 s and pushed 2.1x the output throughput. The endpoint picker, which moved from the Gateway API Inference Extension repo to llm-d/llm-d-router, scores pods from an approximate index of prefixes it already routed or from KV-cache events vLLM publishes over ZMQ.
Routing only reunites a request with a prefix that still exists. After Roan's merge, a perfect picker would have found a warm pod holding 496 matching tokens and nothing past them.
Links
One integer
CDN teams know this from the other end: a tracking parameter slips into the cache key and the origin pool scales out for traffic that never grew. Client-side sharding over Redis does it when a new node remaps keys and the miss rate reads as load to everything behind it.
The pull request in Roan's story changed 512 to 500.
Questions? Feedback? Reply to this email. I actually read them.
Ilia