

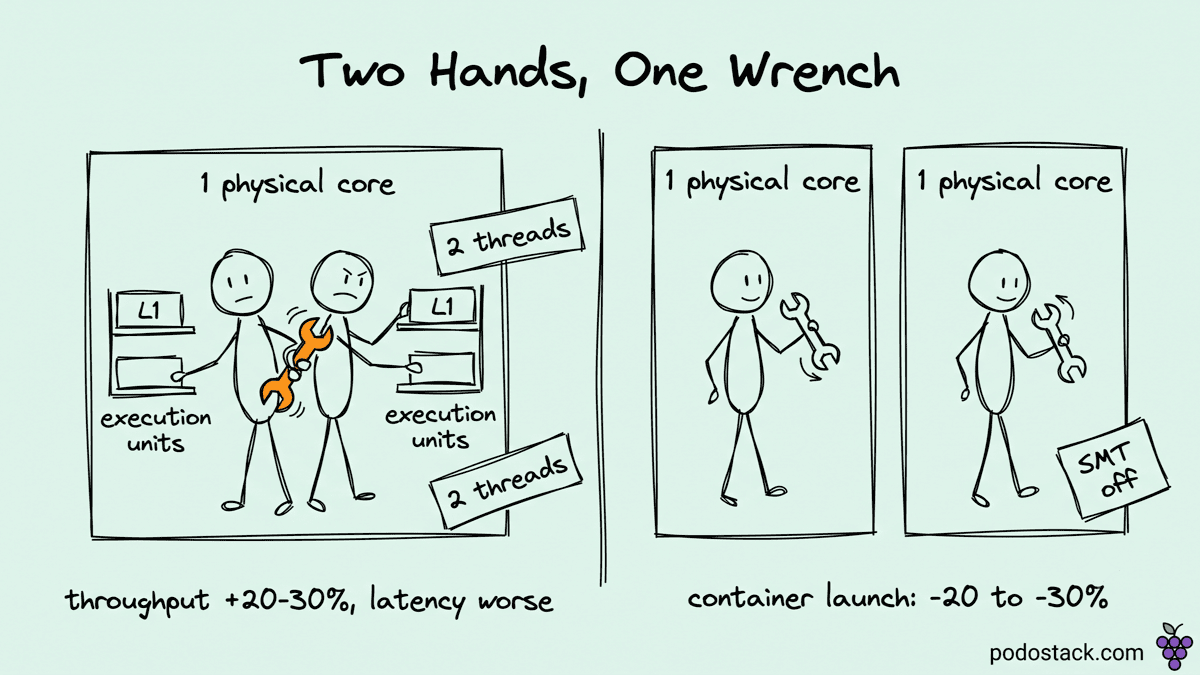
Turning hyperthreading off halves your logical core count. Every capacity model you have says that's a bad trade.
Netflix did it on an m7i.metal-24xl and container launch latency improved by 20 to 30%.
The workload was the mount storm from this week's issue: a hundred containers coming up at once, twenty thousand mount syscalls, all funnelling through one global kernel lock. Under that specific shape of load, more logical cores made things worse.
What a hyperthread actually is
An SMT sibling isn't a core. It's a second set of architectural registers bolted onto one physical core, sharing that core's execution units, its L1 and L2 caches, its TLB, and its share of memory bandwidth.
The bet SMT makes is that a single thread leaves a lot of that machinery idle. Waiting on memory, mispredicting a branch, stalling on a dependency. A second thread fills those gaps, and on a mixed workload it usually does, which is where the familiar 20-30% throughput number comes from.
That bet is about throughput. Nobody ever claimed a hyperthread makes an individual thread finish sooner. It can only make it finish later, because the core it was using alone is now shared.
Most of the time you don't care. Then you hit a lock.
Why contention inverts the trade
Take a spinlock, or any lock whose waiters burn CPU rather than sleeping. Two threads on the same physical core, both spinning on the same cache line.
They're now competing twice. Once for the lock, which is the competition you knew about. And once for the execution units and cache of the core they share, which is the one nobody models.
The waiter isn't idle while it spins. It's issuing loads, hammering the same cache line, consuming issue slots. Those are exactly the resources the lock holder needs to finish its critical section and release. So the waiter slows down the holder, which lengthens the critical section, which means more waiting, which means more interference.
Turn SMT off and every runnable thread gets a whole core. Fewer threads spinning at once, and the one holding the lock gets undivided execution resources to get out of the critical section. Total wait drops even though you halved the core count.
The number of logical cores went down. The rate at which the lock changes hands went up. Under contention that second number is the one that decides your latency.
Where this shows up
The pattern needs two things: a hot lock, and enough parallelism to keep both siblings of a core busy fighting over it. That combination is more common than it sounds.
Kubernetes nodes under container churn. CI runners, serverless backends, anything doing rapid pod turnover, where the kernel's mount and cgroup paths become the contended resource. This is the Netflix case.
JVM applications with heavily contended synchronized blocks, or a ConcurrentHashMap where the access pattern collapses onto one bucket. The JVM's biased-lock optimisations stopped helping years ago and were removed in JDK 15.
Databases under high concurrency on one hot table. Postgres buffer-mapping locks, MySQL latch contention. There's a reason database vendors have historically recommended physical-core sizing for these workloads rather than counting vCPUs.
In-memory stores with a global structure. Redis is single-threaded for command execution so it dodges this, but the surrounding I/O threads and anything doing global key-space operations do not.
How to tell whether it's you
The tell is that your tail latency degrades faster than your average as concurrency rises. If p50 is flat and p99 is climbing while CPU utilisation still looks reasonable, contention is a good hypothesis.
From there, perf will tell you where the time goes:
perf lock record -a -- sleep 10
perf lock report --sort wait_total
If a single lock dominates wait_total, you have the first of the two ingredients. Then check whether the busy threads are landing on sibling pairs:
lscpu -e=CPU,CORE,SOCKET | head
# CPU 0 and CPU 24 sharing CORE 0 means those two are siblings
Testing it is cheap and reversible, which is the best thing about this whole topic. You don't need a maintenance window or a new instance type:
echo off | sudo tee /sys/devices/system/cpu/smt/control
# and back
echo on  | sudo tee /sys/devices/system/cpu/smt/control
Run your benchmark both ways on one node. If the answer is no, you've spent ten minutes.
The limits worth knowing
This is not an argument that SMT is bad. For CPU-bound stateless work with little shared state, the throughput win is real and you should take it. Batch processing, video encoding, most stateless request handling that isn't fighting over anything.
The trade also moves with core count. On a machine with a small number of physical cores, halving them hurts more than the contention does, and the inversion may never show up. Netflix measured this on a 24xlarge, where there were plenty of physical cores to go around.
And there's a second reason this button exists. After Spectre, L1TF and the MDS family, several clouds already recommend SMT off for multi-tenant workloads, because sibling threads sharing a core also share the microarchitectural state those attacks read. If you're turning it off for isolation anyway, measure the performance side while you're there. It may not be the cost you budgeted for.