
Issue #023 - Namespaces aren't free: where 7 TiB of memory was hiding
DaemonSet listwatch, per-node informer cache, Calico netpols, Vector log source, kube-state-metrics cardinality

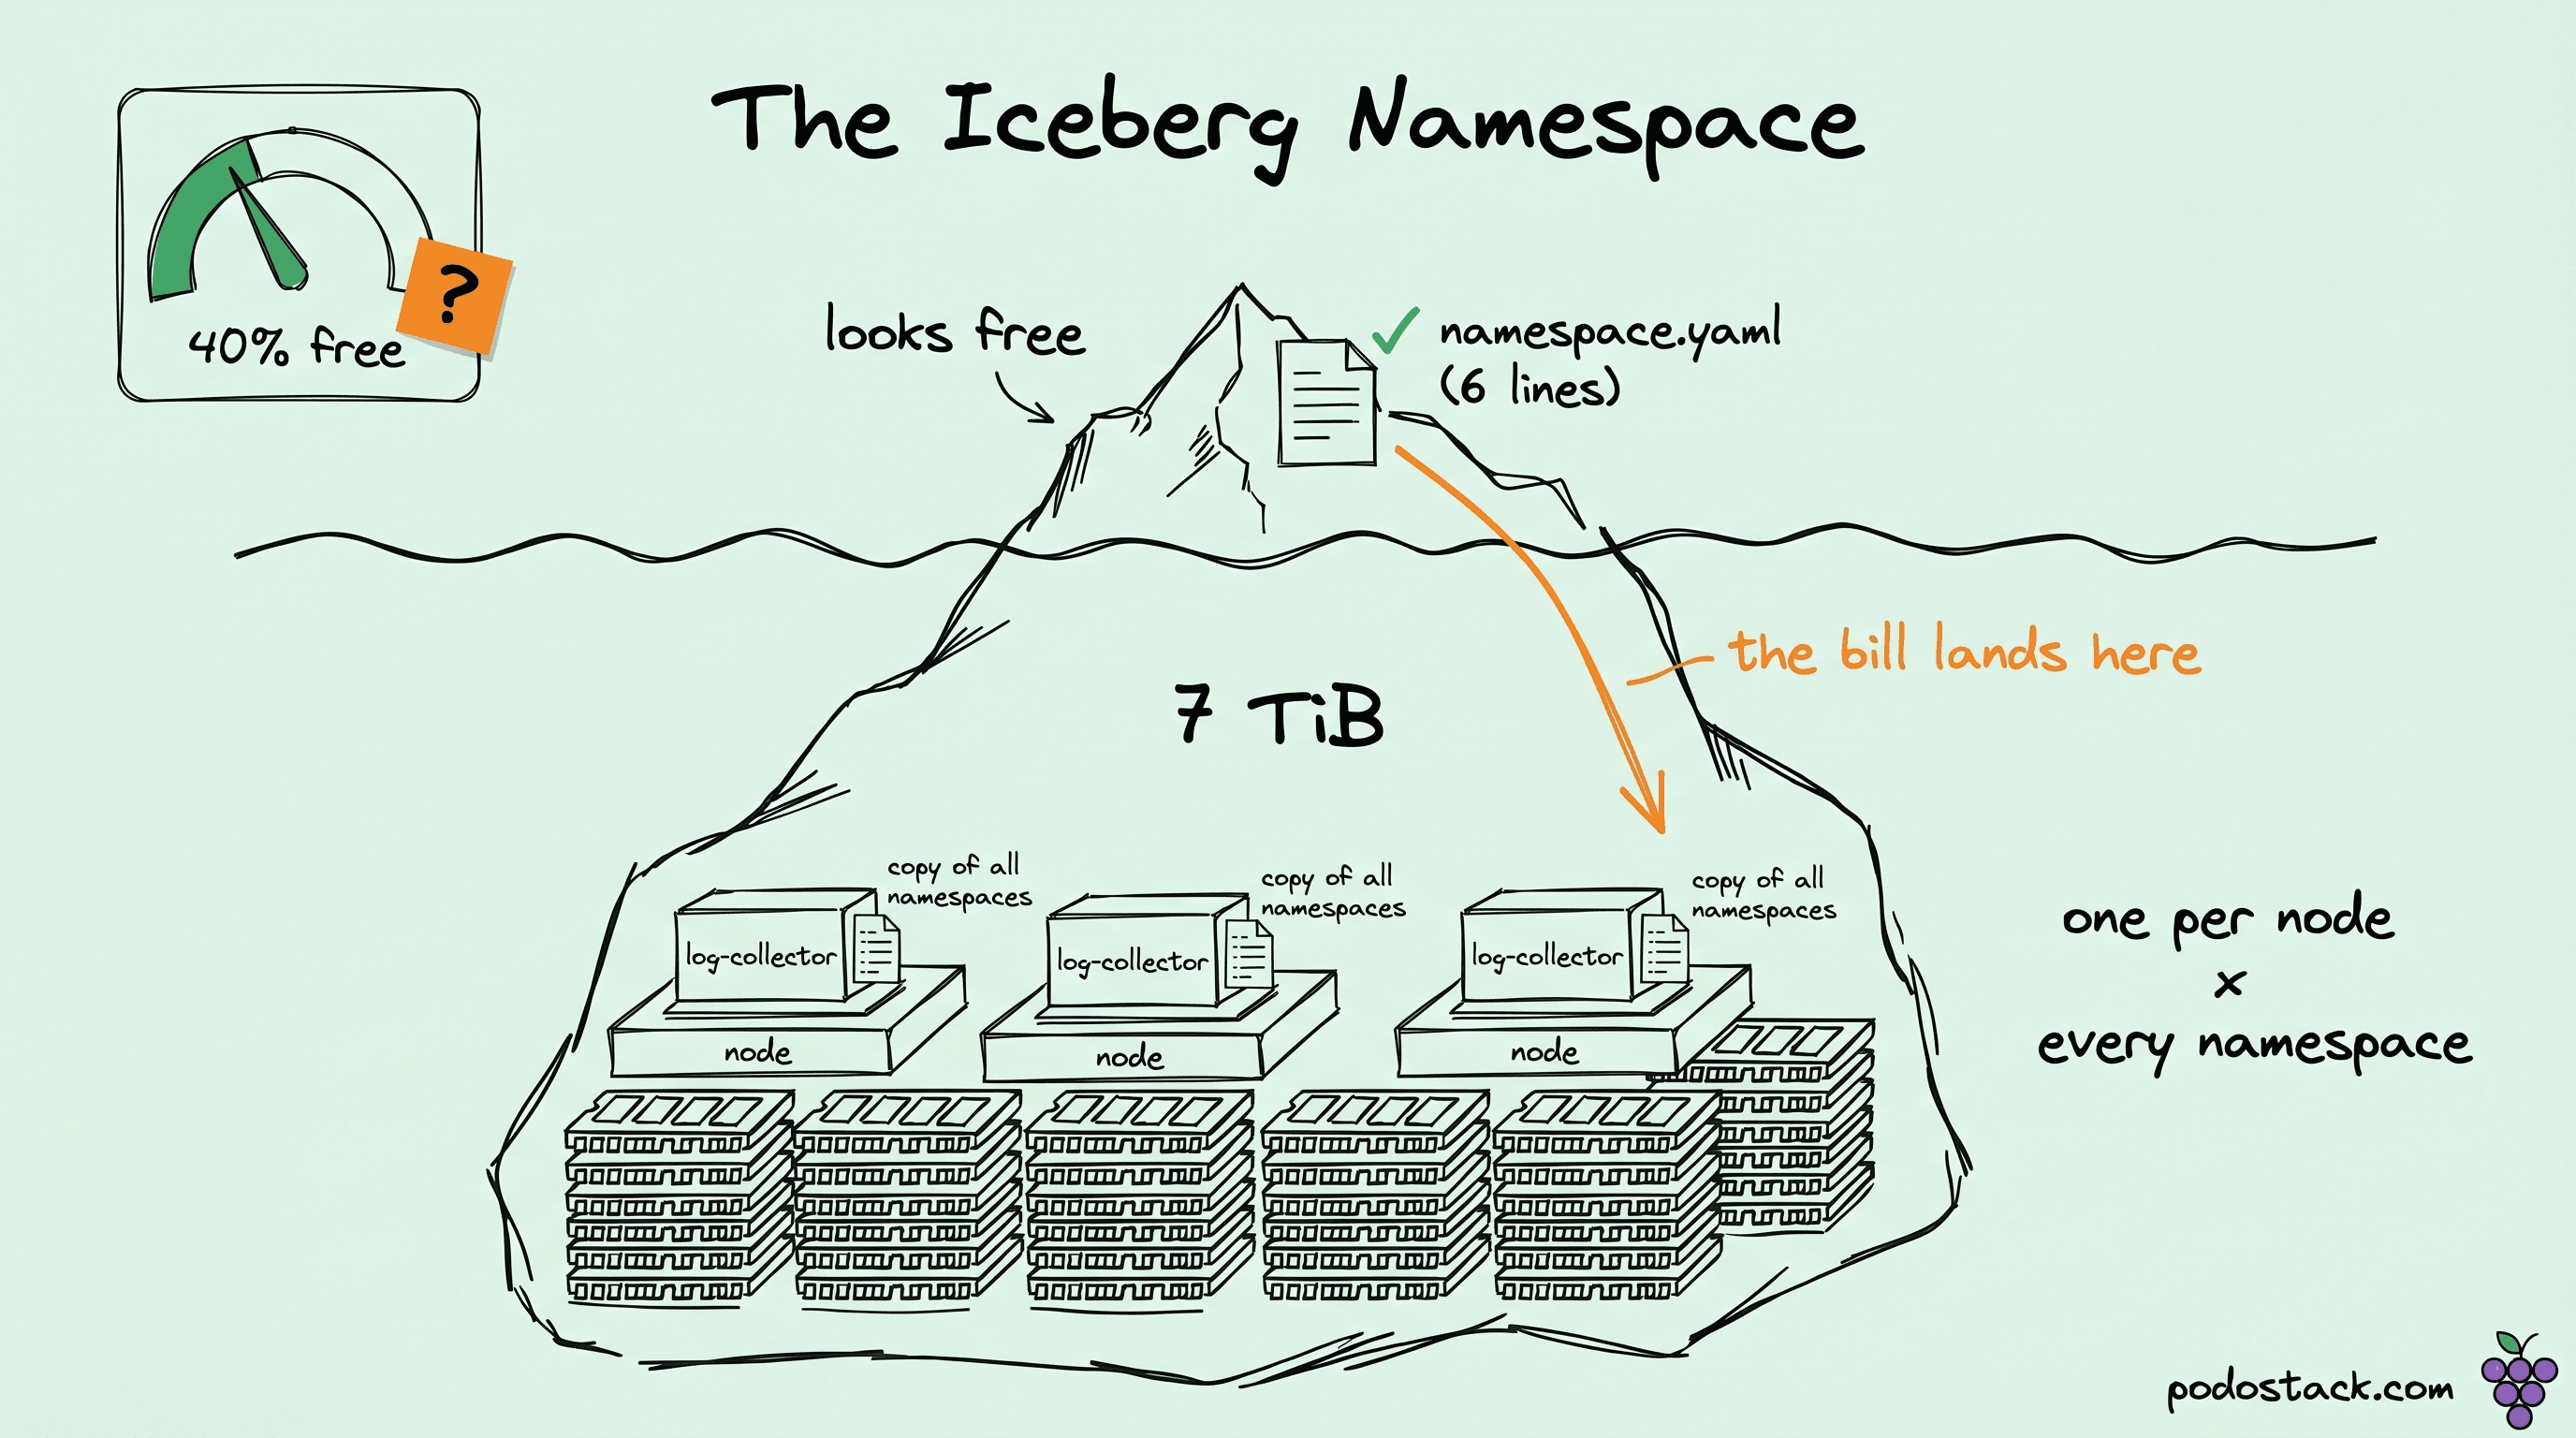
The capacity dashboard said we had headroom. Forty percent of the cluster's memory free, green across every node, the kind of graph you glance at and stop thinking about. Then a routine DaemonSet rollout - a log-shipper bump, nothing structural - took three nodes into OOMKilled territory inside ninety seconds, and the pods that died weren't the workloads. They were the agents - the log shippers we'd deployed to keep an eye on everything else.
I spent the first hour convinced it was a leak in the shipper. It wasn't. The agent was doing exactly what it was configured to do, which was keep a local copy of every namespace in the cluster so it could tag each log line with the namespace's labels. We'd grown from a few hundred namespaces to a few thousand over eighteen months, one per tenant, and nobody had drawn the line from "more tenants" to "every DaemonSet pod on every node now holds a few thousand more objects in memory." So the dashboard was right that the RAM was free. It just didn't tell me the agents had quietly reserved most of the rest to mirror a list.
A namespace looks like the cheapest object in Kubernetes. You make one with a six-line YAML and it costs nothing to create. The bill arrives somewhere else entirely, on a different node, in a process you didn't write, and it scales with a number you stopped tracking.
🐛 Debug Story: reconstructing the 7 TiB that nobody allocated
The cleanest public version of this story isn't mine. It's Render's, and it's worth walking through because they hit the wall at a scale almost nobody else reaches, which makes the mechanism impossible to miss.
Render runs a PaaS. Every customer service lands in its own namespace, so where a normal cluster lives with tens or low hundreds of namespaces, Render's own framing is that they suspect they're "near the very top" on exactly that axis. When you're at the top of a scaling dimension, the costs that everyone else rounds to zero stop rounding to zero.
The investigation didn't start with namespaces. It started, as these things do, somewhere adjacent - they were looking at Calico's memory use, because per-namespace NetworkPolicies were the thing visibly stressing it. They built a staging cluster with several hundred thousand namespaces to reproduce, and that test rig is what surfaced the real pattern. The netpols were a scaling factor. They weren't the big one.
Following the memory
The component that turned out to be holding the memory was Vector - the open-source observability pipeline Render ran as their log collector, deployed as a DaemonSet. That last part is the whole story, so it's worth being precise about why.
A DaemonSet puts one pod on every node. That's correct and that's the point - a log collector has to be local to the logs. But Vector's kubernetes_logs source was doing something most people never inspect: to enrich each log line with the labels of the namespace it came from, it kept a watch on the namespace API. Not a watch scoped to one namespace. A watch on all of them. And because the collector is a DaemonSet, every node ran its own independent copy of that watch.
So the cost wasn't per-namespace and it wasn't per-node. It was the product. Each pod held a local cache of every namespace object, and there was one such pod per node. Render's own phrasing is the cleanest summary I've seen: "each of those pods independently performs a listwatch on the same resources. As a result, memory usage increases with the number of nodes." Stack the namespace axis on top of the node axis and you get a memory footprint that grows like nodes times namespaces, in a process whose job description is "ship logs."
The number that came off the worst pods was around 4 GiB each, just for that cached state. Multiply by the node count on a large cluster and you're into the terabytes on a single cluster before a single log line has been usefully processed.
The fix was a feature flag they had to write
There was no clever cache-tuning trick here. The namespace watch existed to support one optional behavior - tagging logs with namespace labels - and most of Render's pipeline didn't need it. The fix was to make that watch opt-in instead of always-on. Render contributed the change upstream to Vector: a config option (insert_namespace_fields) that, when off, stops the collector from watching namespaces at all. With the watch gone, there's nothing to cache, so each pod stops keeping its own copy of the cluster's namespace list.
The catch they hit on the way - and the reason I trust the writeup - is that the first rollout didn't free as much as expected, because they had two kubernetes_logs sources on the user nodes and had only flipped the flag on one. They had to go back and find the second one before the numbers moved, which is the kind of detail a sanitized retrospective drops. Once both were corrected, per-pod memory dropped from those ~4 GiB down to "just a few tens of MiB."
The aggregate, applied across their whole fleet: one large cluster gave back about 1 TiB, and the total across the infrastructure was roughly 7 TiB of memory that had been sitting there doing nothing but mirroring a list. The 7 TiB is the number that gets quoted, but it's not the part that changed how I look at cluster bills. Not one byte of it showed up under a namespace. It showed up under a log collector, on every node, attributed to a workload that had nothing to do with the tenants whose existence was driving the cost.
Links
🏗️ Architectural Pattern: why per-namespace cost is roughly O(namespaces)
Render's 7 TiB is the extreme case, and the extreme case is useful precisely because it makes a quiet linear cost loud. The same slope exists in your cluster at a few hundred namespaces. It's just under the noise floor, which is exactly why it's dangerous - it grows without ever tripping an alert, until the day it does.
I want to be careful here, because this topic attracts hand-waving and the readers who'd catch it are the ones I'm writing for. When I went back through the incident, two things had been tangled together that scale very differently with namespace count.
The thing that does NOT cost per namespace
A DaemonSet pod is per node, not per namespace. This trips people up constantly, so it's worth nailing down: adding a namespace does not add a node-exporter pod, or a kube-proxy, or a CSI node plugin. Those are placed once per node and stay there no matter how many namespaces you create. The pod count of a DaemonSet is a function of your node count, full stop.
What scales with namespaces isn't the number of agent pods. It's what each of those pods has to know. A DaemonSet that watches a namespace-scoped resource type - namespaces themselves, NetworkPolicies, Services, EndpointSlices - holds a cache whose size tracks the count of those objects, and most of those object types grow as you add namespaces. So the number of agents stays flat while the memory inside each one climbs with every tenant you add. I'd spent the first hour of that incident looking at the flat number, which is exactly where the cost wasn't.
Where the real slope lives
The mechanism underneath all of this is the client-go informer, and it's worth understanding because it's the same machine inside almost every controller, operator, and agent you run. An informer opens a watch against the API server and keeps a local in-memory cache of every object matching its scope, kept current by the stream of ADDED/MODIFIED/DELETED events. The cache is the feature - it's what lets a controller answer "what Services exist" without hammering the API server. But by default that cache is cluster-wide. Every object of the watched type, in every namespace, materialized in the process's heap, deep-copied out of the wire format into Go structs.
So the cost of one informer is roughly: number of objects in scope, times the size of each object, times the number of processes running that informer. Add a namespace and you've added its default ServiceAccount, its EndpointSlices, whatever NetworkPolicies and Services and ConfigMaps come with a tenant. Every informer cluster-watching those types just got a little bigger, in every replica, on every node if the watcher is a DaemonSet. None of it is a leak. It's the cache doing its job at a scale the cache's author didn't picture.
There's a second cost that doesn't show up as agent memory at all, and it's the one that bites the control plane: the API server has to serve all those watches. Each watching client holds an open connection and gets a stream of every relevant change. The kube-apiserver maintains its own watch cache to fan this out, but the connection count and the event volume both climb with watchers times objects. The failure mode Render flagged is the rollout: when a DaemonSet's pods all restart at once, they re-LIST the world simultaneously, and that thundering herd of full LISTs can, in their words, "overwhelm the server with requests and cause real disruption." The steady state is expensive. The synchronized cold start is the part that takes the cluster down.
The things that genuinely track namespace count
Walk the per-namespace machinery and the linear costs stack up, none of them individually alarming:
When you create a namespace, the controller manager's serviceaccount-controller and token-controller spin up a default ServiceAccount and its token plumbing for it - automatic, per namespace, forever. CoreDNS watches Services and EndpointSlices cluster-wide; its own sizing guidance is (Pods + Services) / 1000 + 54 MB, so more tenants means more Services means a fatter DNS cache on every CoreDNS replica. kube-state-metrics builds a time series per object across every namespace, so its scrape payload and memory climb with the object count until you're sharding it across a StatefulSet just to keep the /metrics endpoint from timing out. Any operator that watches all namespaces - cert-manager, an ingress controller, a service-mesh control plane, a monitoring agent - carries its own informer cache with the same slope. And admission webhooks configured cluster-wide get invoked for matching operations in every namespace, so a webhook that was cheap at fifty tenants is doing real work at five thousand.
No single line of that is a problem. The architecture problem is that they're all the same slope at once, and a namespace is the unit that pays into every one of them simultaneously while appearing, on its own ledger, to cost nothing. You're not provisioning a namespace. You're provisioning a row in a dozen different caches you don't own and a dozen different watch streams you can't see.
Links
🛠️ The practical part: measuring the tax, then cutting it
The reason this cost stays invisible is that nothing attributes it to namespaces. So before any mitigation, the first job is to make the slope visible, and most of that you can do with tools already in the cluster.
Finding the slope
The first thing I checked that night was a question I'd never bothered to ask before the cluster forced it: how many namespaces do we actually have, and is that number growing.
$ kubectl get ns --no-headers | wc -l
3847

$ kubectl get networkpolicies -A --no-headers | wc -l
3812

$ kubectl get serviceaccounts -A --no-headers | wc -l
9216
If those counts are in the thousands and climbing, the slope is already in your cluster whether or not it's hurting yet. The next question is which processes are paying for it. The agents to suspect are the ones that are both cluster-watching and replicated per node - DaemonSets - so sort their pods by memory:
$ kubectl top pods -A --sort-by=memory | grep -E 'vector|fluent|cilium|calico|otel|datadog'
kube-system   cilium-9x4kp       412Mi
logging       vector-agent-7fh2k 3964Mi
logging       vector-agent-2bnq9 3871Mi
A log agent sitting at 4 GiB while the workloads it's collecting from use a fraction of that is the signature. When you see one DaemonSet pod an order of magnitude heavier than its peers across the fleet, and the number tracks your namespace count rather than your log volume, you've found a process holding a mirror of the cluster it doesn't need. For the deeper attribution Render did - confirming which watch is responsible - a continuous profiler like Pyroscope or a go tool pprof heap dump against the agent's debug endpoint shows the informer cache as a fat allocation, but kubectl top plus the namespace count usually tells you where to look first.
The fixes, in order of how much you have to give up
The cheapest fix is the one Render shipped: stop the watch you don't need. If an agent is caching a resource type only to support a feature you're not using, turn the feature off. The namespace-label enrichment in a log collector is the classic example - the watch that powered it was free until namespaces stopped being free.
When you do need the watch, scope it. An informer doesn't have to be cluster-wide. client-go and controller-runtime both let you constrain a watch with a label selector, a field selector, or a fixed list of namespaces, and the cache then only holds what matches. A label selector is the most expressive lever - field selectors can only filter a handful of indexed fields - so the durable pattern is to label the objects an agent actually cares about and watch by that label:
# controller-runtime: cache only the namespaces a tenant-agent owns,
# instead of mirroring all 3,847 of them
cache:
  byObject:
    namespaces:
      label: "podostack.com/tenant-agent in (true)"
That single constraint is the difference between a cache that grows with the whole cluster and one that grows with the slice you operate. It's also the change with the best ratio - you keep the functionality, you drop the slope.
Past tuning, the lever is structural: stop treating the namespace as the tenant boundary. A namespace was never an isolation primitive; it's a name scope with some RBAC and quota bolted on, and every cluster-wide controller still sees straight through it. If the reason you have thousands of namespaces is hard multi-tenancy, the honest tool is a virtual cluster - vCluster gives each tenant its own API server and control plane, so a tenant's Services and NetworkPolicies live in that tenant's control plane and stop landing in every host-level informer's cache. The cost is real and worth naming: you're now debugging two layers, and your host monitoring won't see into the guest clusters without extra wiring. Hierarchical namespaces (HNC) sit between the two - they organize namespaces into a tree with inherited policy, which helps governance but does nothing for the per-namespace informer cost, because to every cluster-wide watcher an HNC namespace is just another namespace. Worth knowing what each one actually buys, because only one of them touches the slope this issue is about.
The decision compresses to this. A few hundred namespaces and flat: do nothing, the cost is real but under your noise floor. Thousands and climbing, with soft multi-tenancy: audit your DaemonSets and operators, scope or kill the cluster-wide watches, and you'll likely find your own smaller version of the 7 TiB. Thousands and climbing because you're running a hard-multi-tenant platform: the namespace was the wrong boundary, and a tenancy layer that gives each tenant a real control plane is what stops the slope at the source rather than tuning it down one informer at a time.
Links
Until next week
The part I keep coming back to: the cost was never where the abstraction said it was. You provision a namespace, the bill lands on a log collector on a node you weren't looking at, and the only way to find it is to stop trusting the org chart of your cluster and follow the memory instead. Go run kubectl get ns | wc -l on your busiest cluster and then kubectl top pods -A --sort-by=memory. If those two numbers are correlated, you've got a smaller version of this sitting in your fleet right now.
Next Tuesday we stay with things that aren't supposed to be visible, and look at how eBPF reads TLS traffic without ever touching the private key - decrypting at the syscall boundary, before the bytes hit the network. See you then.
- Ilia