

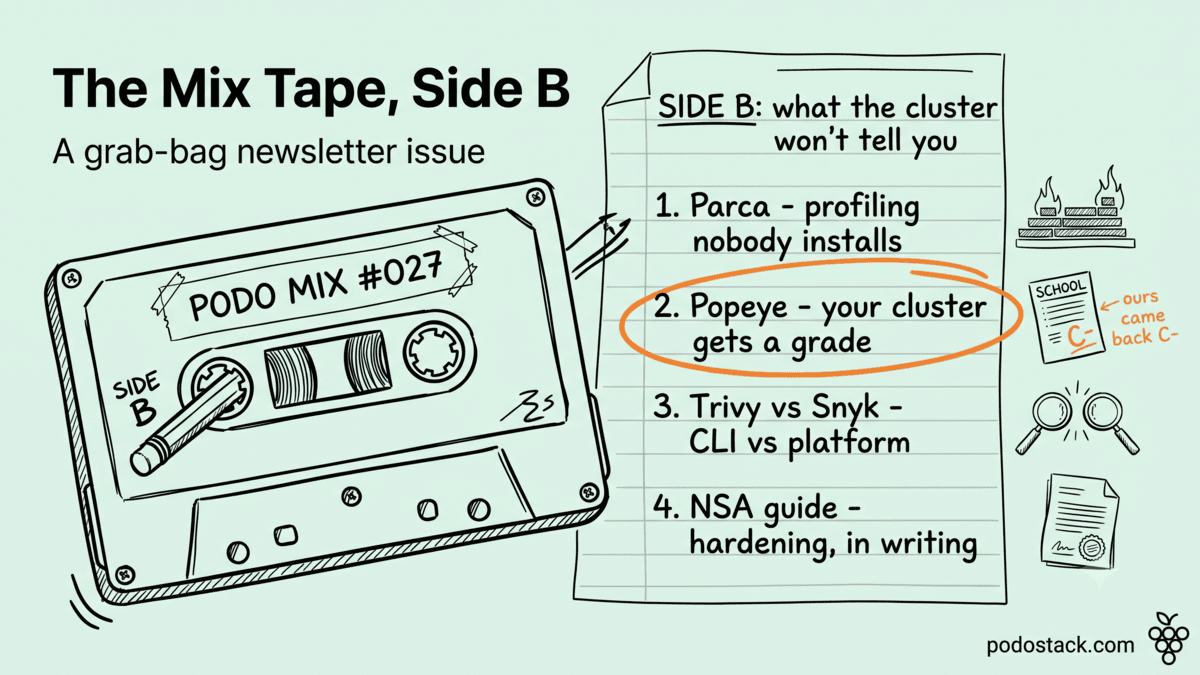
Two grab bags in a row. I said last week I was breaking the deep-dive format on purpose, and then this month handed me four more things that belong together.
Because this time there is a spine. Every one of these four answers the same question from a different angle: what is your cluster actually doing, and how would you find out? A profiler that needs nothing from your code. An auditor that gives the whole cluster a letter grade. Two scanners that disagree about what a vulnerability even is. And a hardening guide written by the people whose day job is breaking into things.
Side B of the mixtape.
🚀 Sandbox Watch: Parca
What it is
Continuous profiling for Kubernetes, built on eBPF. It samples what every process on every node is doing with CPU and memory, all the time, and keeps the history.
Not "profiling" as in the thing you enable for twenty minutes when something is already on fire. Profiling as in metrics: always on, always recording, there when you need to look backwards.
How it works
The collector runs on the node and reads stacks from the kernel. No SDK in your application, no rebuild, no restart, no sidecar. Because it works below the language, one agent covers the mixed reality of an actual cluster - Go, Java, Python, Rust, C++, and the kernel itself. It unwinds stacks even for binaries built without frame pointers, which is most of what you're running whether you know it or not.
Storing this is the hard part. A cluster's worth of stack samples is enormous, so Parca stores profiles in a columnar database built for exactly that shape of data, which is where the compression comes from.
Why I like it
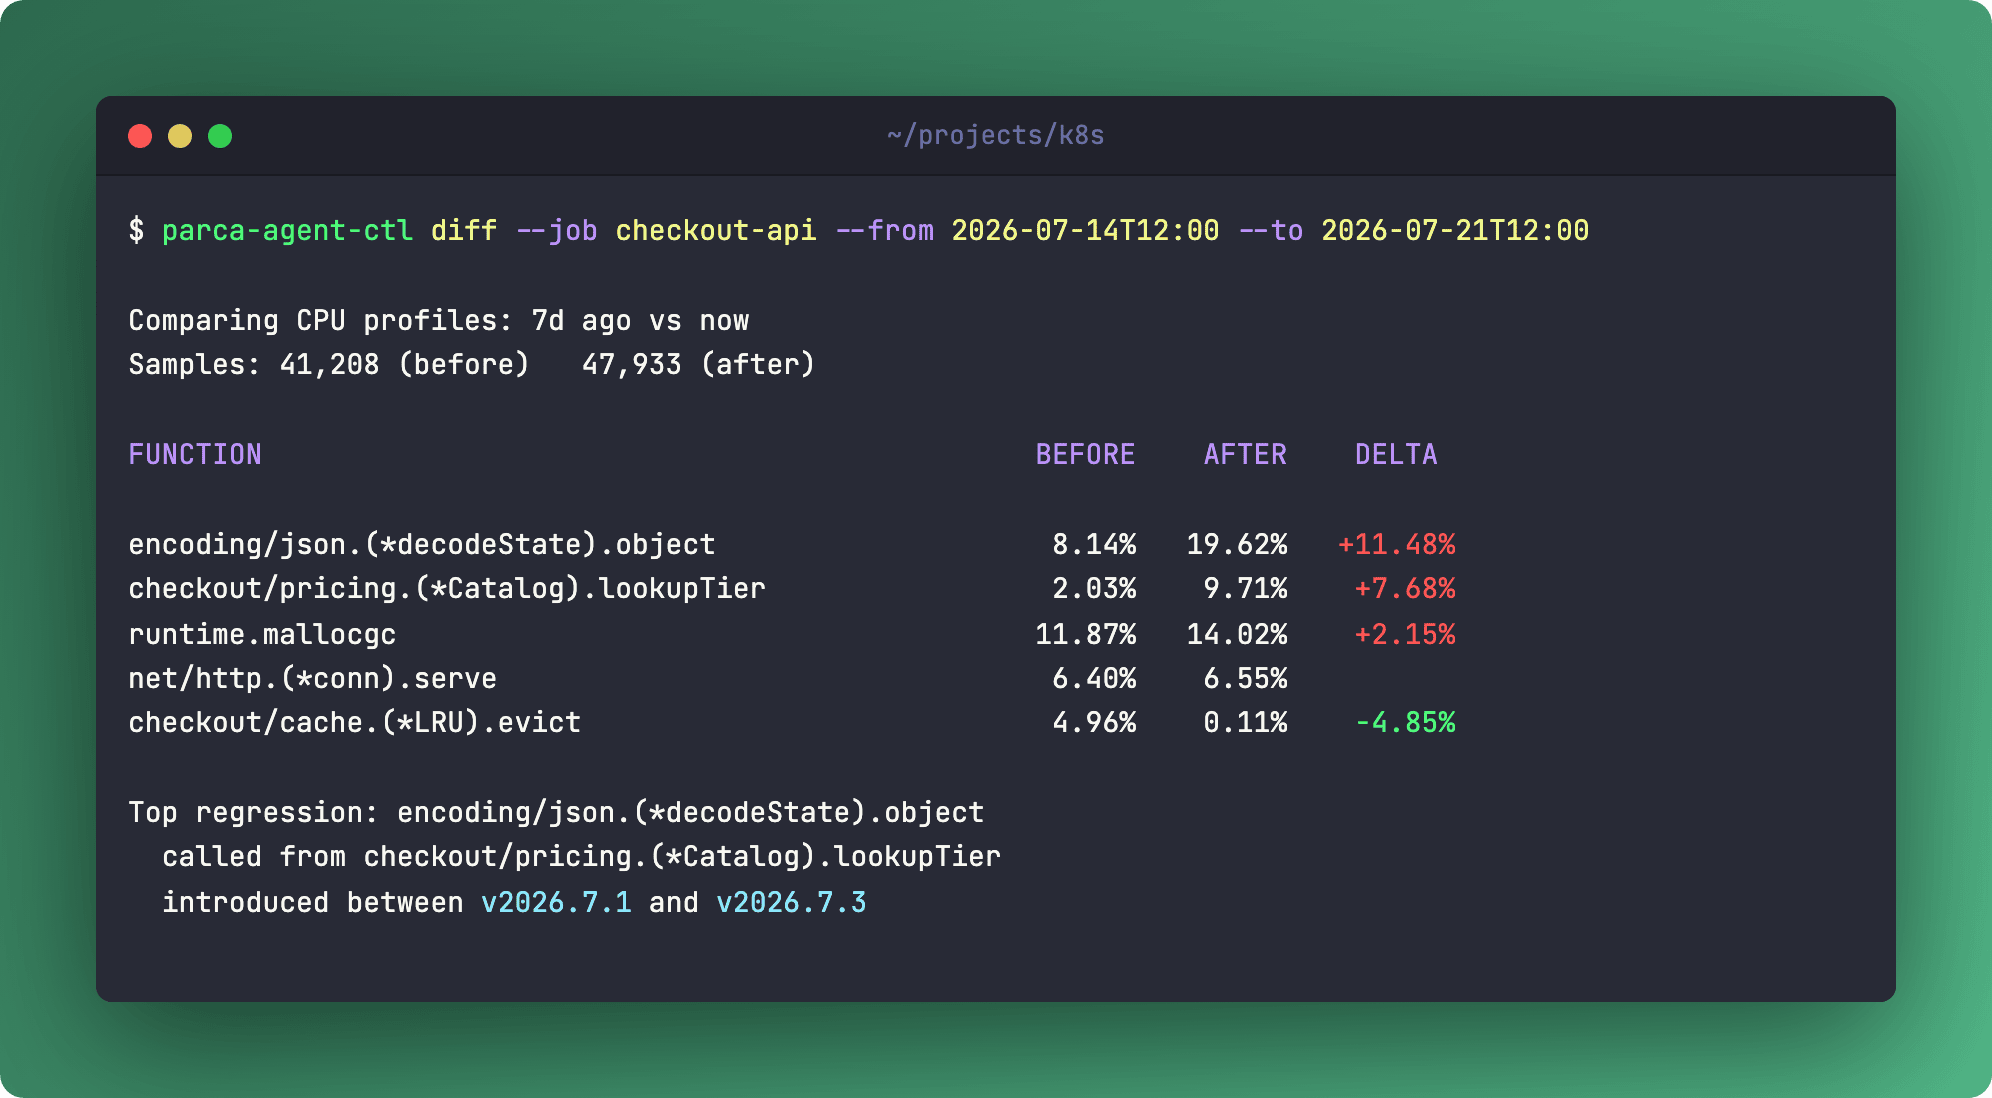
Differential profiling. You pick two windows - before the release and after it - and Parca shows you which function got more expensive. Not "CPU went up 12%", which any dashboard tells you. Which function.
We lost most of a week last autumn to a memory graph that stepped up after every deploy. The dashboards said the API pods were heavier. The traces agreed the slow endpoint was slower. Neither got us past "somewhere in the API pods" until somebody profiled a container by hand on a Thursday and found a cache that never evicted. Twenty minutes of differential profiling would have pointed straight at it.
When to use it
The overhead claim is under 1%, against the 10-30% a traditional in-process profiler costs you - that's the whole reason "continuous" is possible at all.
Honest context: the continuous-profiling market consolidated when Pyroscope went to Grafana Labs, and if your shop is already all-in on Grafana, that's the path of least resistance. Parca's argument is that it stayed the eBPF-native, Kubernetes-native option instead of becoming a feature of somebody's platform. It's Apache 2.0, v0.28.0 landed in May, and commits are still going in this month - so this is a live project, not a preserved one. Which of those two paths matters more to you is a question about your stack, not about the profiler.
Links
💎 The Hidden Gem: Popeye
What it is
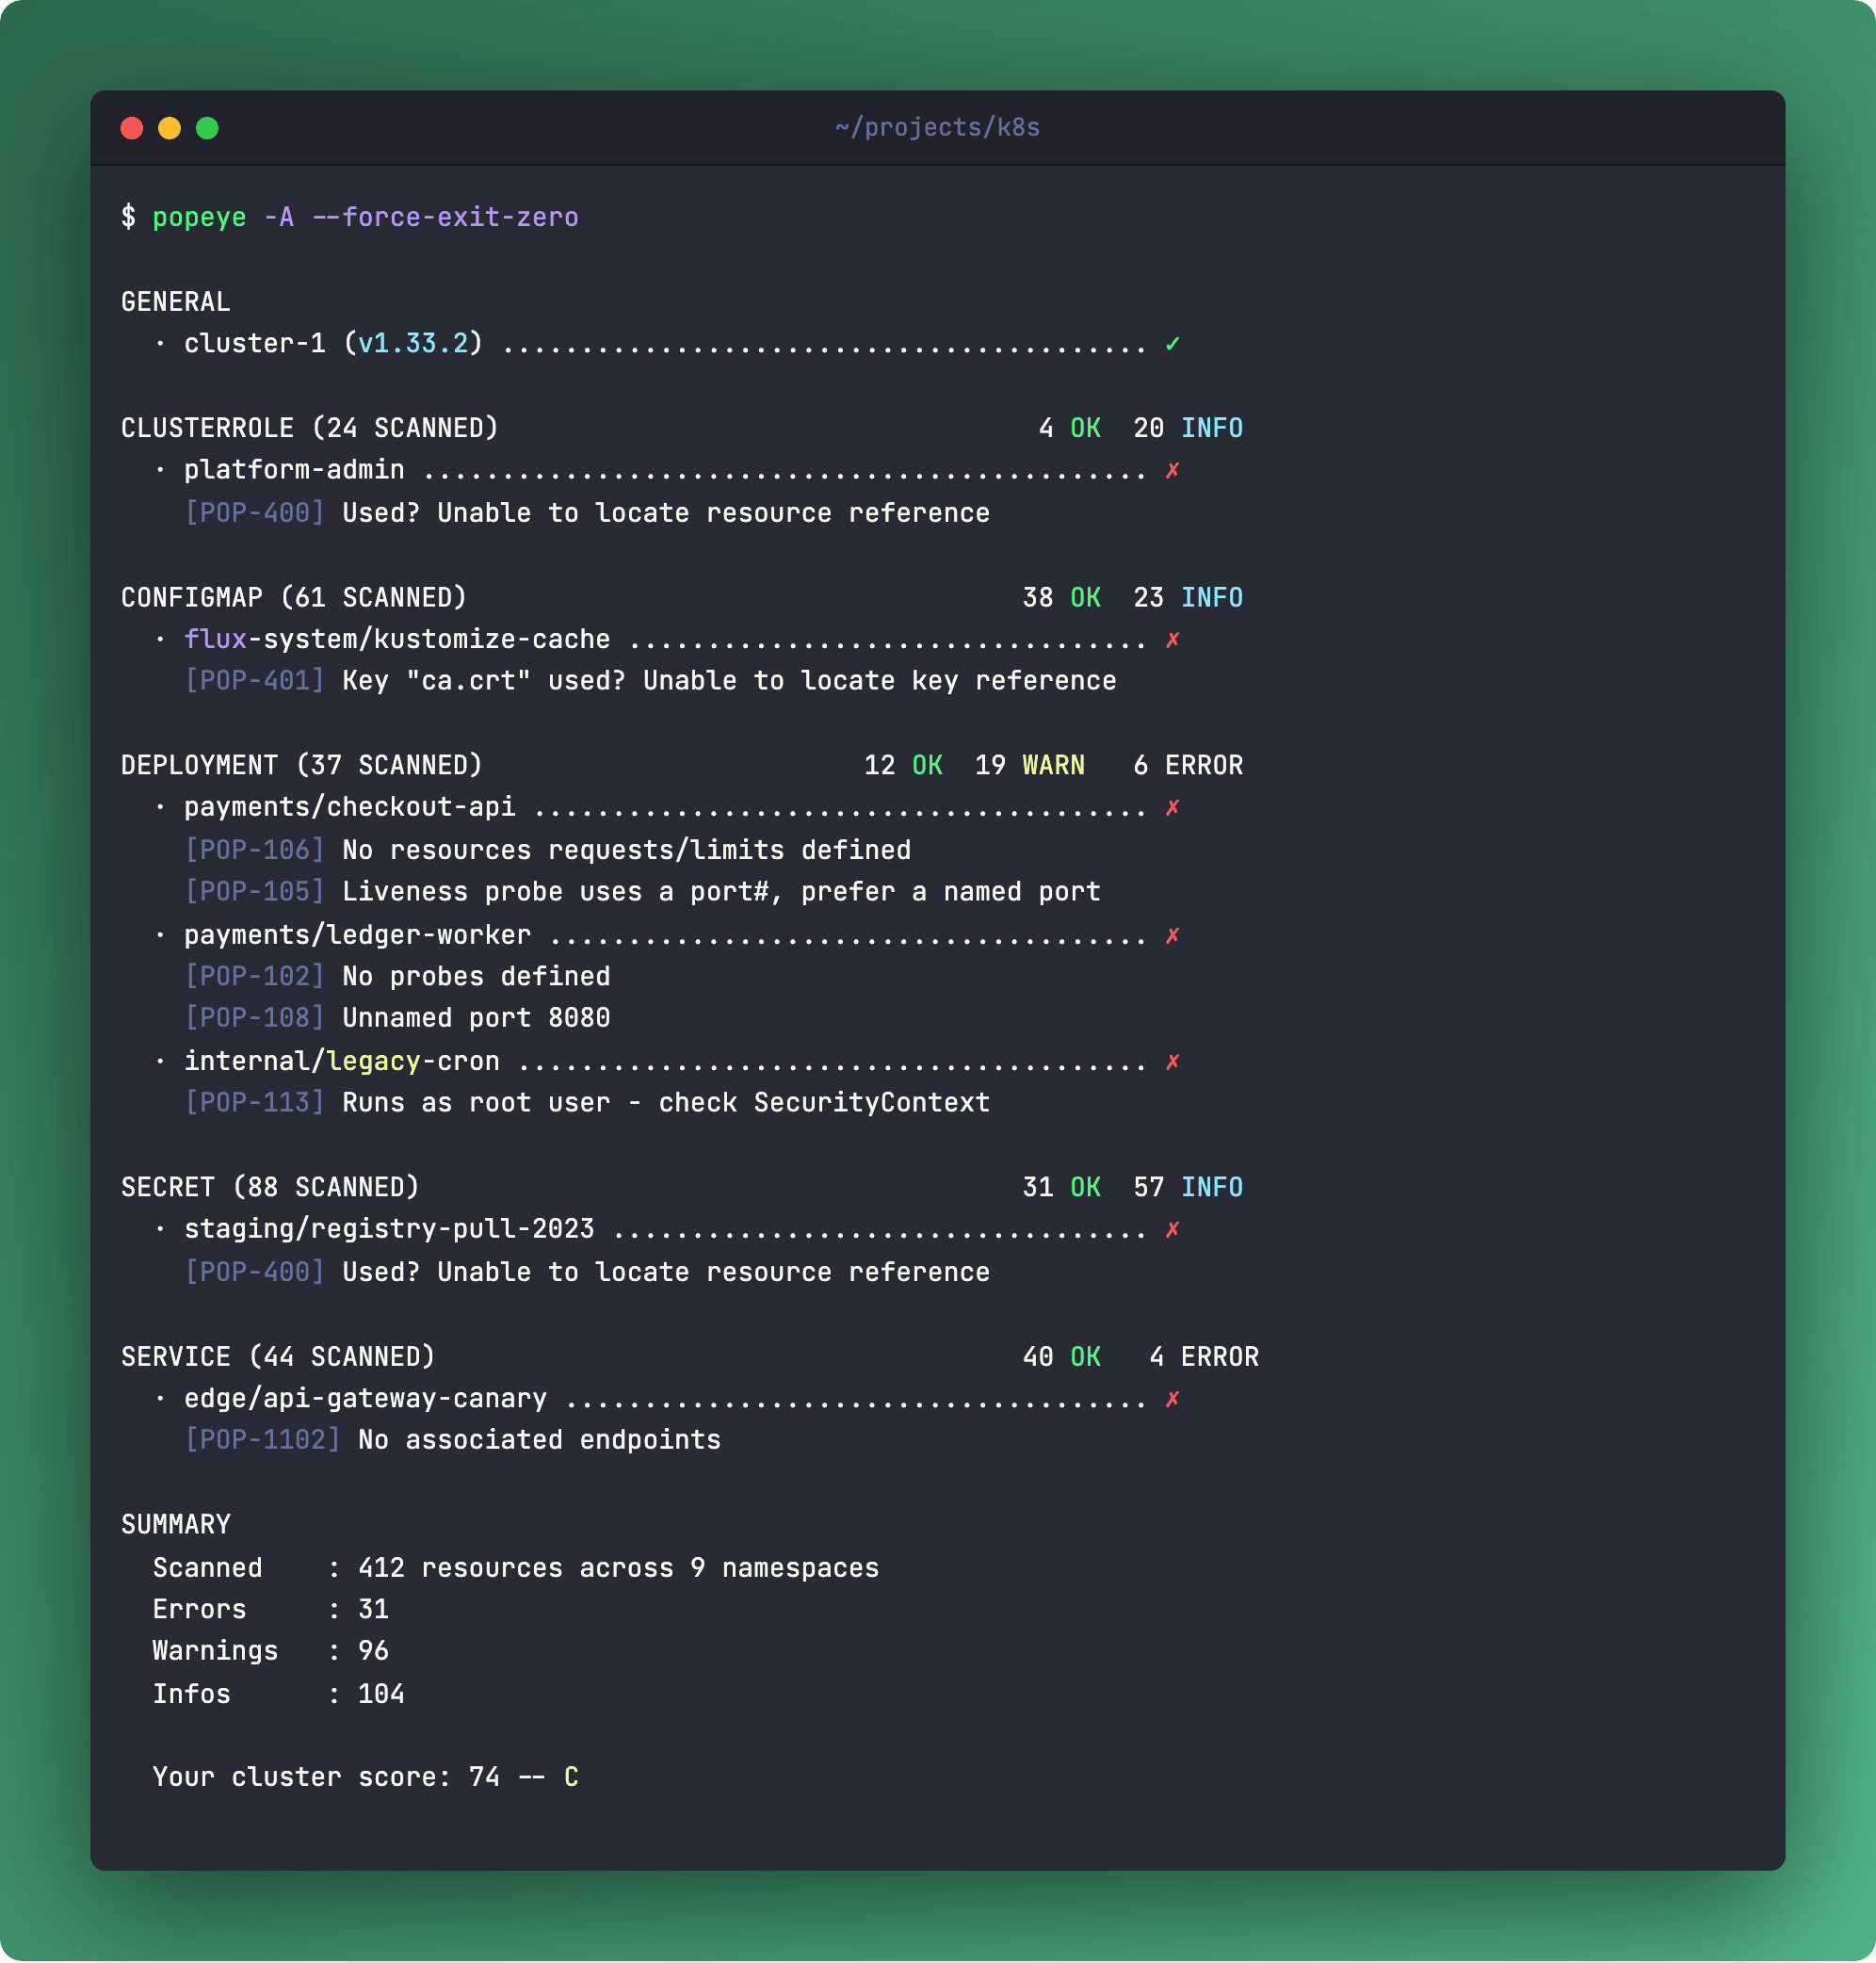
A read-only scanner that walks your live cluster and hands back a report card. Letter grade, A through F, plus every finding that dragged it down.
It ships from the same author as k9s, which tells you what to expect: a single binary, fast, opinionated, made by somebody who clearly spends their day in a terminal looking at clusters.
How it works
Point it at a kubeconfig and run it. It reads - only reads - and reports what it finds: Secrets and ConfigMaps nobody references, containers with no resource requests or limits, pods with no liveness or readiness probe, Services whose selector matches nothing, port mismatches between Service and Pod, containers running as root, deprecated API versions you're still calling.
Each check is a sanitizer with its own code, so you can mute the ones that don't apply to you in a config file instead of learning to ignore them.
Why I like it
The grade is the trick, and it's a psychological one rather than a technical one. A list of 340 warnings gets closed. A cluster with a D gets discussed in standup. Same data, completely different organizational outcome - and I've watched that happen more than once.
The second use is upgrade prep. Before a version bump, Popeye tells you what still calls APIs that are about to disappear, which is a lot cheaper to learn on a Tuesday than during the upgrade window.
When to use it
The caveat you need before you adopt it: Popeye is quiet. The last release, v0.22.1, shipped in January 2025, and the last commits landed at the end of that year. Meanwhile k9s - same author - put out a release last month. Draw your own conclusion about where the attention went.
I'm still recommending it, and here's the reasoning. This is a read-only tool you run manually against a cluster, not a controller you put in the critical path of anything. The blast radius of "unmaintained" here is that new checks stop arriving and new API deprecations eventually go unnoticed - annoying, not dangerous. That's a very different risk than running an unmaintained admission webhook. Just know what you're picking up, and don't wire it into a pipeline that has to keep working in 2028.
Right tool, right stage, too. Popeye reads the live cluster, so it catches what actually got deployed, including the thing somebody applied by hand in March. Static YAML analysis in CI catches problems before they land but can't see drift. An admission controller enforces rules but doesn't tell you about the mess you already have. Three different jobs; Popeye only does the third.
Run it read-only. Give it a ReadOnly RBAC role and nothing more - it never needs write access, so don't hand it any.
Links
⚔️ The Showdown: Trivy vs Snyk
The comparison everyone gets wrong
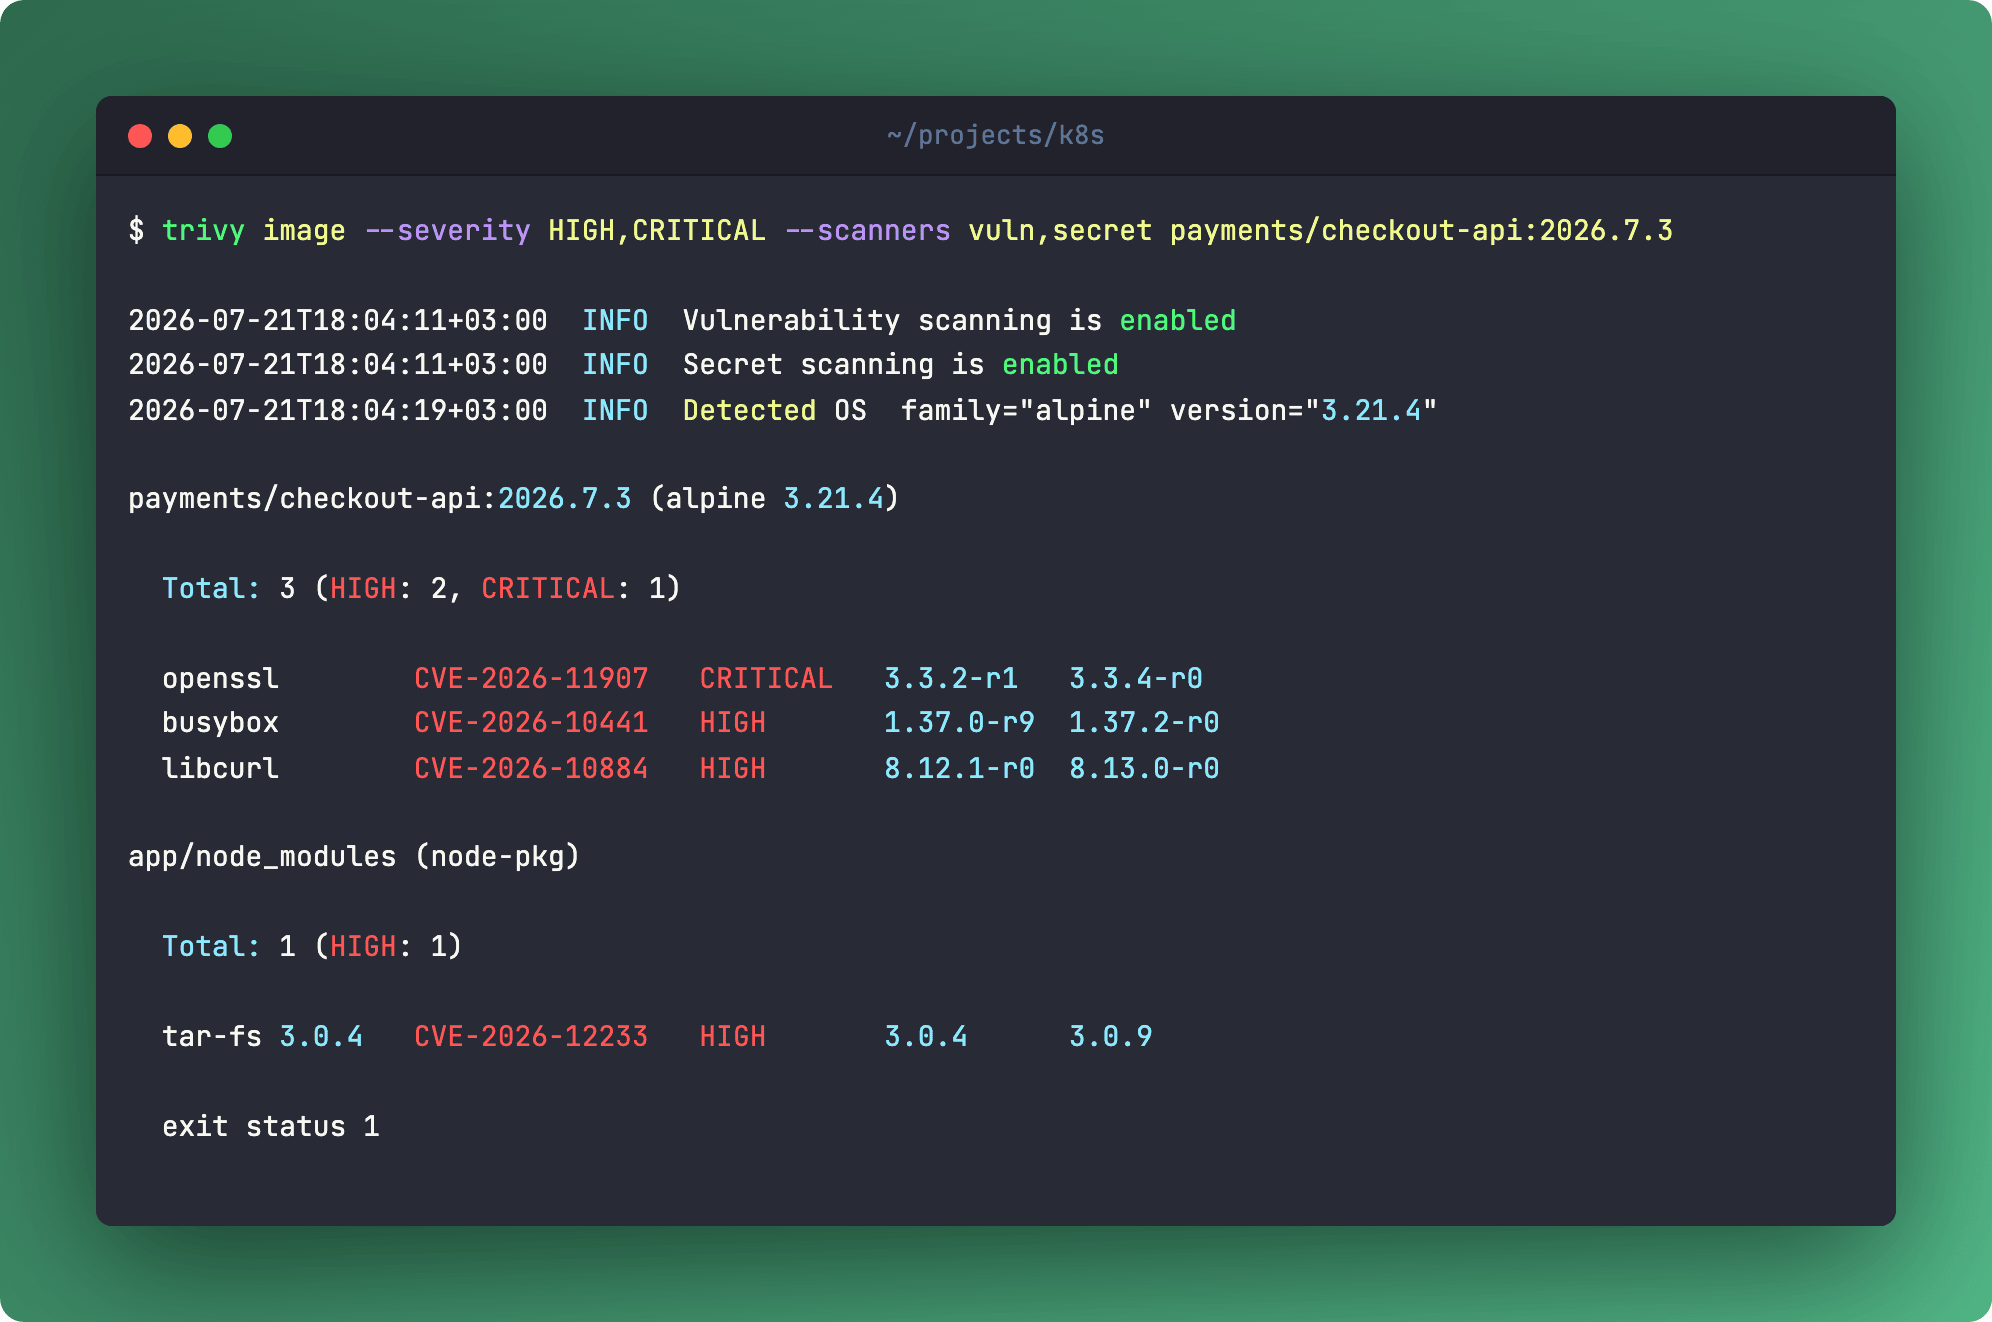
These get benchmarked head to head constantly, and the benchmarks are close to meaningless, because one is a tool and the other is a product. Trivy is a scanner: a binary, in your pipeline, exit code 1, done. Snyk is a vulnerability management platform that happens to contain a scanner.
I've sat in the meeting where somebody put a "finds 14% more CVEs" slide on the wall. Nobody in the room asked what happened to the findings after they were found, which turned out to be the only question that mattered six months later.
Where they actually differ
The database. Trivy aggregates public sources - NVD, and the per-distro feeds from Red Hat, Debian, Alpine. It's excellent on OS packages and rarely lies to you there. Snyk maintains its own curated database, which typically knows about things before NVD does and carries more context per finding.
Reachability. This is Snyk's real weapon, and Trivy has no full answer to it. Trivy tells you a vulnerable version of a library is present. Snyk can tell you your code never calls the vulnerable function. On a large monolith that difference is the difference between a security team triaging 400 criticals and triaging 40.
What you get at the end. Trivy gives you a report - JSON, SARIF, a table - and expects you to build the process around it. Snyk opens the pull request that bumps the dependency. If your goal is developers fixing their own findings without a security engineer chasing them, that gap is the entire product.
Price and gravity. Trivy is Apache 2.0, unlimited, runs entirely on your infrastructure, and never sends your code anywhere - and it is very much alive, with v0.72.0 out at the end of June. Snyk is per-developer at enterprise scale and that math gets steep - and it wants your source. For some organizations that's disqualifying before the feature comparison starts.
My read
If you're building a platform, keep Trivy in the pipeline. It's the boring correct default: free, fast, self-hosted, no vendor in the critical path of your build.
Buy the platform when the bottleneck stops being detection and becomes triage - too many findings, too few people, developers who won't act on a JSON report. That's a real problem and it's worth money to solve. Just be honest that you're buying triage and developer experience, not better detection.
And note the shape of it, because this newsletter keeps running into the same shape: the open tool does the work, the commercial platform sells you the workflow around the work. Same as the last two issues, different corner of the stack.
Links
👮 The Policy: the hardening guide written by the NSA
Why this one is worth your time
The NSA and CISA publish a Kubernetes Hardening Guide. It is free, it is specific, and almost nobody in our industry has read it - which is odd, given that it's a defensive checklist from the agency with the most credible offensive team on the planet.
I opened it expecting compliance boilerplate. What's in there reads much more like the ways clusters actually get taken, written by people who take them for a living.
What it actually asks for
Nothing exotic, which is the point:
Containers run as a non-root user, with a read-only root filesystem, dropping every capability they don't need. No privileged pods, no host namespaces, no hostPath mounts into anything that matters.
Network policy that denies by default. Not "we have some network policies" - a default-deny posture where a compromised pod can't reach the rest of the cluster, because flat pod networking is what turns one bad container into a cluster-wide incident.
RBAC that's actually least privilege, with cluster-admin as a rare exception rather than the shape of every service account. Audit logging turned on and shipped somewhere off-cluster, because logs on a compromised node are evidence you no longer control. Images scanned, and the control plane and etcd locked down.
The honest part
The guide came out in August 2021 and was last revised in August 2022. CISA now files the announcement under archived content, with the standard banner about information that may no longer reflect current policy. Four years is a long time in this ecosystem.
But read what's actually in it and almost none of it has expired, because the failure modes haven't changed. What has changed is that Kubernetes grew native answers: Pod Security Standards now cover a good chunk of the container-level requirements, and the restricted profile is close to a working implementation of that whole section. So treat the guide as the argument for *why*, and Pod Security Standards plus a policy engine as the *how*.
The part I actually took from it was smaller than the document. We picked four of those requirements, wrote them down as the standard for our platform, and moved them into admission. The wiki page that had said roughly the same thing had been sitting there ignored for about a year and a half before that.
Then check it from the outside - which is where this issue closes its own loop. Popeye will tell you which containers run as root and which workloads have no probes. Trivy will tell you which images shouldn't be there. The guide tells you what the answer is supposed to be.
Links
That's side B. Four tools that answer the same question - what is this cluster really doing - from four different distances.
Popeye is the one that'll surprise you fastest. It took about five minutes against our staging cluster and came back with a grade I chose not to mention in standup.
Questions? Feedback? Reply to this email. I actually read them.
- Ilia