

Five deep-dive weeks in a row, and I promised the next open week would break the pattern. What landed in it doesn't share a vendor or a language, but it shares a shape: each of these four is a boundary someone drew somewhere you wouldn't expect. How much structure an LLM really needs. How much a registry needs to run at all. Where Prometheus Operator's declarative reach quietly stops. And what Kubernetes itself is willing to call a bug.
Grab bag's back.
🚀 Sandbox Watch: TOON
What it is
A serialization format built specifically for LLM context, not for storage or wire transfer. Token-Oriented Object Notation - TOON for short - shipped in October 2025 from a single maintainer, Johann Schopplich, MIT licensed. It hit Hacker News and picked up over 2,000 stars in three days. It's sitting past 25,000 now.
How it works
Not a compression trick. TOON borrows YAML-style indentation for nested objects, then switches to a CSV-like table layout the moment it sees an array of uniform objects - which is most of what actually gets shoved into a prompt: query results, API responses, tool-call output. Each array gets an explicit [N] row count and a {fields} header up front. That's not for humans. It's a guardrail the model uses to check its own parsing as it goes, instead of guessing where one object ends and the next begins from indentation alone.
The numbers, and where they stop working
The project's own benchmark: 46.3% fewer tokens than formatted JSON, at 70.1% accuracy on retrieval tasks. An independent run across four models - Claude Haiku, Gemini Flash, GPT-5 Nano, Grok - found 39.6% fewer tokens, with accuracy that came out higher than JSON's, 73.9% against 69.7%.
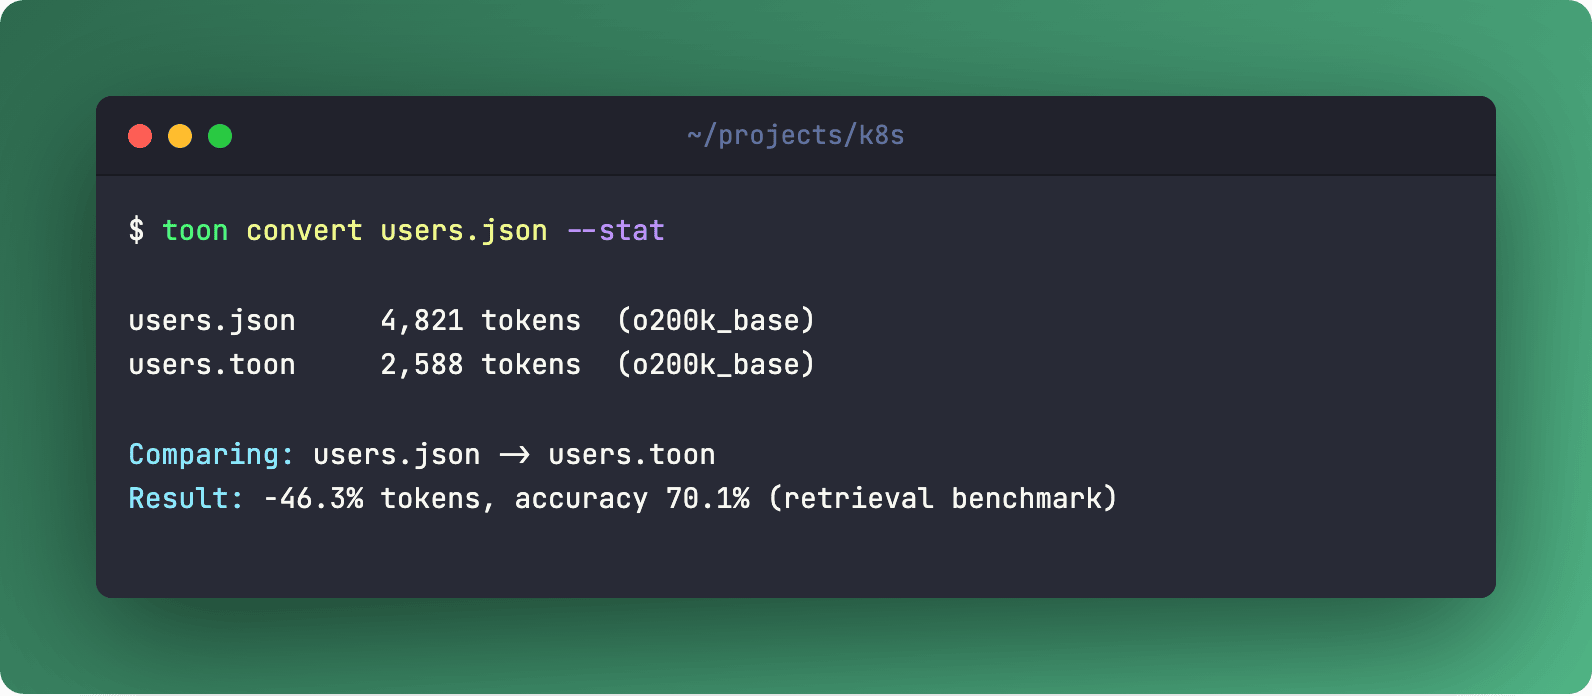
The authors are upfront about where it loses, too. Deeply nested or non-uniform data - minified JSON often wins outright. Semi-uniform arrays, somewhere around 40-60% field consistency, and the savings mostly evaporate. Purely tabular data - plain CSV is still smaller, TOON's explicit lengths and field lists cost you 5-10% over that. And on local or quantized models, some setups parse JSON faster in wall-clock time even while burning more tokens to do it.
When to reach for it
Not as a database format, not as an API contract - the authors call it a translation layer for LLM input, and that's the honest framing. If you're stuffing a hundred rows of uniform records into a context window before a completion call, it's worth trying. If your payload is one deeply nested object, don't bother.
Links
💎 The Hidden Gem: zot
What it is
A vendor-neutral, OCI-native container registry. CNCF Sandbox since December 2022, still shipping - v2.1.19 landed in early August. About 2,700 stars, small next to Harbor's, but the commit graph is alive.
Where it differs from Harbor
I went looking for "zot has full OCI Distribution Spec support, Harbor doesn't" as the pitch, and that angle is stale - Harbor implements spec 1.1 too now, so that's not a real differentiator anymore.
The real one: zot runs with no database at all. Harbor needs Postgres behind it. For an edge deployment or anything resource-constrained, that one line is the whole pitch: one static binary, no stateful dependency to babysit. zot also has native support for the OCI Referrers API, which is the mechanism Cosign actually uses to store and look up signatures, so signature and SBOM attachment works as a first-class citizen rather than a bolted-on scan step.
The honest trade
Harbor still has a web UI. RBAC, project-based multi-tenancy, built-in vulnerability scanning, replication between registries, audit logging - and it's CNCF Graduated, zot is Sandbox. None of that is small. zot isn't trying to be a Harbor replacement; it's what you reach for when you want a registry to just serve OCI artifacts and nothing else runs on the same box.
CoreWeave uses zot as the registry behind their CKS Kubernetes service - it's in their own changelog, not a case study somebody paid for.
Links
⚔️ The Showdown: the Probe CRD gap nobody's closed
The comparison I went looking for, and didn't find
I went in expecting a head-to-head: some operator wrapping Prometheus Blackbox Exporter versus using Blackbox Exporter directly. What I found instead is that the project going by that description - endpoint-monitoring-operator, 23 stars - isn't a Blackbox Exporter wrapper at all. It's its own thing: a separate EndpointMonitor CRD, its own probe logic for HTTP, HTTP-with-JSON-body-validation, TCP, DNS, ICMP, even Trino and OpenSearch health checks, and it alerts straight to Slack or email. It doesn't talk to Prometheus. So the comparison as pitched doesn't exist - which turned out to be more interesting than the comparison itself.
Where the real gap is
Prometheus Operator ships a Probe CRD for exactly this job - declaratively wiring blackbox-style checks to Blackbox Exporter, either a static target list or auto-discovered from your Ingress objects. It's mature, it's part of kube-prometheus-stack, most clusters running the standard observability stack already have it.
But it was built for simple, ping-style checks. Go looking at the project's own GitHub discussions and you'll find someone trying to describe hundreds of HTTP targets, each with its own headers and body, and hitting a wall - the Probe CRD has no way to express per-target Blackbox module configuration at that level. A maintainer's own answer in that thread: what's actually missing is "a CRD to deploy and manage Blackbox Exporter" itself, not just targets pointed at one. That issue has been open for years.
My read
That's why people write bespoke operators like endpoint-monitoring-operator instead of extending the Prometheus ecosystem: not out of preference, but because managing Blackbox Exporter's own module config was never made declarative. Anyone whose checks need real assertions - not "did we get a 200," but "does this JSON field say what it should" - ends up walking away from Blackbox Exporter entirely and building something narrower and custom. Nobody built a rival tool here. They just never wrote the CRD that would have made Blackbox Exporter's own config declarative.
Links
👮 The Policy: the RCE Kubernetes calls working as intended
What it takes
This attack starts from one RBAC permission most clusters hand out without a second thought: get on nodes/proxy. No prior foothold on the node, no shell on the cluster required - the permission alone gets you in.
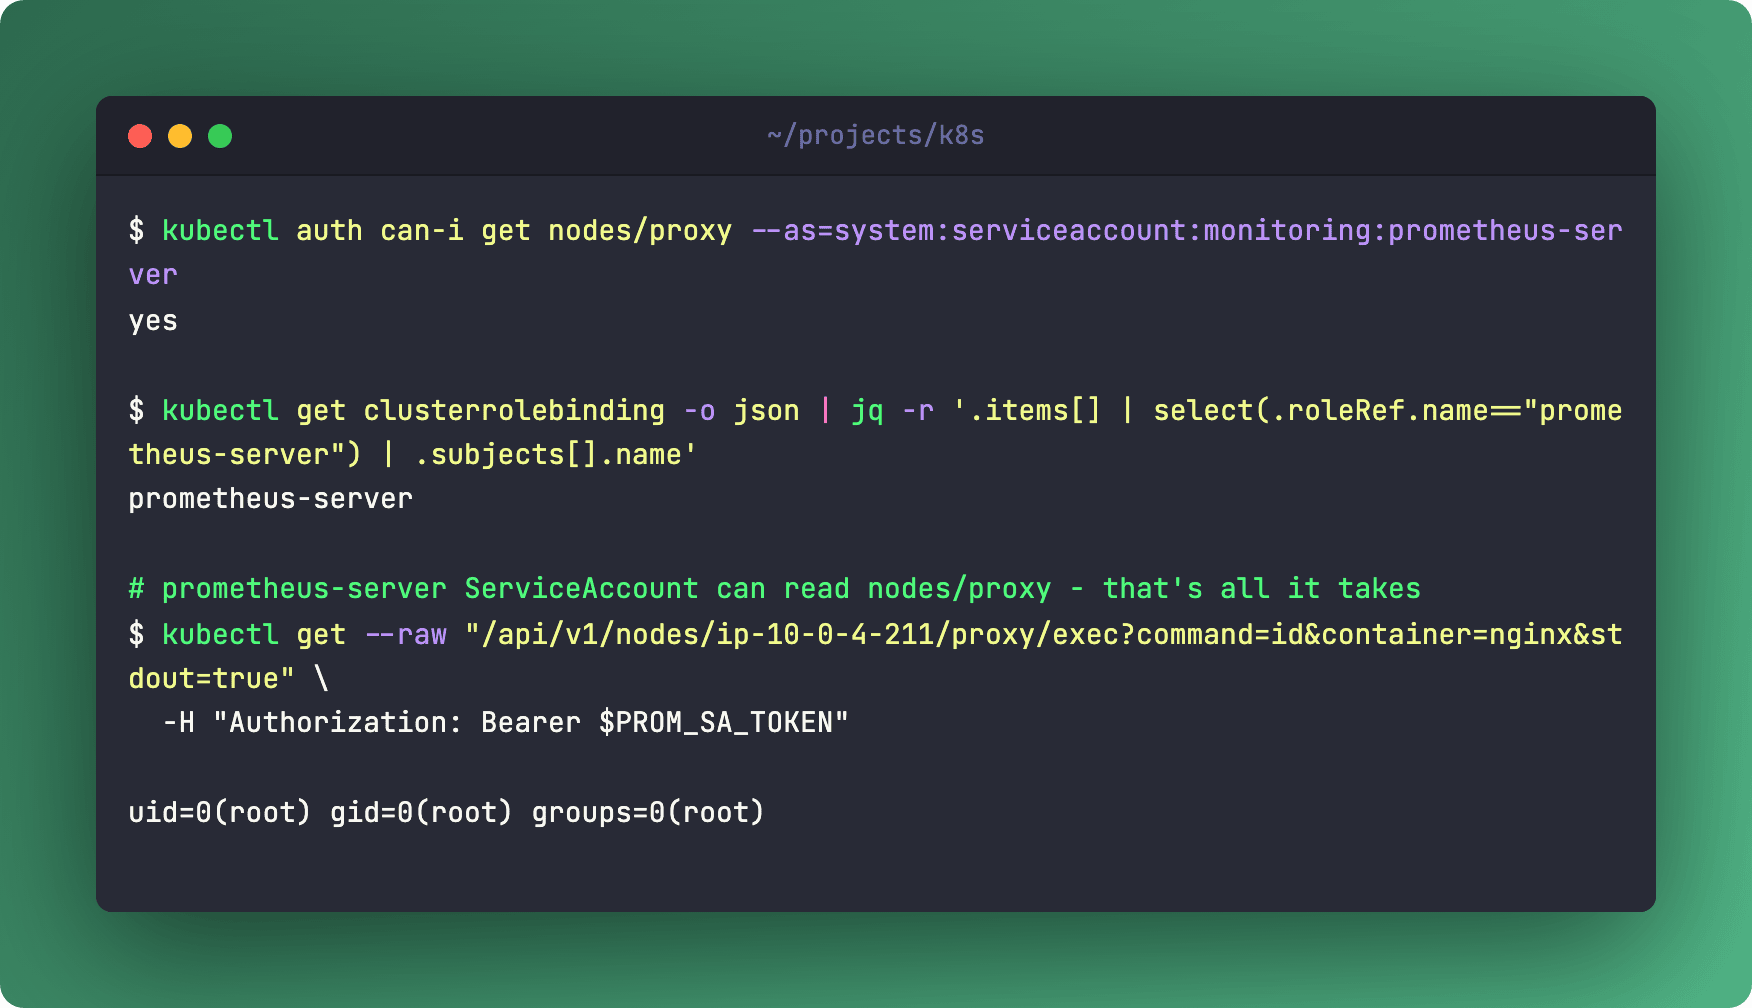
Security researcher Graham Helton published the mechanism in late January. The apiserver's nodes/proxy endpoint is meant to let you read things like node metrics through the apiserver instead of reaching the kubelet directly. The kubelet, on the other end, decides whether to allow a WebSocket upgrade based on the HTTP method of the handshake - and per RFC 6455, that method is always GET. Which means the secondary check that's supposed to gate an actual /exec - the create verb - never fires on the WebSocket path. get on nodes/proxy is enough, by itself, to open a connection to kubelet:10250 and run a command inside any pod on that node.
The 69 charts
Helton didn't stop at the theory - he audited what ships with this permission. Sixty-nine Helm charts grant nodes/proxy get as a matter of course, the full list with links is in his write-up. The names on it are the ones nobody questions: Prometheus, Grafana's Promtail, Datadog, Elastic Agent, Cilium, the OpenTelemetry Collector, Trivy Operator when its cluster role is enabled. Exactly the observability stack most platform teams install without reading the RBAC it asks for.
Working as intended
There's no CVE here, and there isn't going to be one. Kubernetes' Security Response Committee closed it on January 23rd, classified as Won't Fix, working as intended. In their own words, checking a verb at one layer and an HTTP method at another is "brittle, architecturally incorrect" - so instead of patching the specific hole, they're pointing at KEP-2862, Fine-Grained Kubelet API Authorization. It splits the kubelet API into separate, narrower permissions - nodes/metrics, nodes/stats, nodes/log, nodes/healthz, nodes/pods - instead of one nodes/proxy that covers all of it. It's Beta now, behind a feature gate, GA is targeted for April.
Worth being precise about how this differs from the kubelet-API piece I ran back in issue-015: that one assumed an attacker already sitting on the node network, reaching port 10250 directly. This one needs nothing but a ServiceAccount token carrying a permission your monitoring stack probably already has. No node access required at all - a different privilege boundary, not a rerun of the same finding.
What to do about it
Audit which service accounts in your cluster hold nodes/proxy. If you're running any of the standard observability charts, the answer is probably "more than you'd guess." Then treat KEP-2862's rollout as your real timeline, not a patch that's coming - because it isn't.
Links
Four boundaries, four different people drawing them. What TOON decided an LLM doesn't need. What zot decided a registry doesn't need. The CRD nobody at Prometheus Operator got around to writing. And the line Kubernetes drew around what even counts as a bug.
The last one's the one I keep coming back to - not because it got patched, but because it didn't, and it's probably sitting in your cluster right now if you're running anything that watches your nodes.
Questions? Feedback? Reply to this email. I actually read them.
- Ilia