
kube-proxy modes: iptables vs IPVS, and why "proxy" is misleading
iptables rules, IPVS hashing, conntrack table, connection drift on rule reload

The Tuesday morning I rolled out IPVS to a 4,000-Service cluster, I had to roll it back by lunch. The plan looked clean on the change-management ticket: flip kube-proxy from iptables to ipvs mode on every node, watch the dashboards, take the win. The dashboards showed the win immediately. p99 latency on our busiest namespace dropped about 18% within ten minutes and the team Slack picked up the first round of victory emoji.
Then around 10:40 the first ping came in: a small internal Service had stopped getting traffic. Then a second. The third one was a payment service and I stopped reading Slack, opened the rollback playbook, and started typing.
By the time the cluster was back on iptables, about thirty Services had quietly broken during the IPVS window. They had one thing in common, which I didn't know that morning but spent the next two days learning. This post is the one I wish someone had handed me on Monday.
kube-proxy doesn't actually proxy
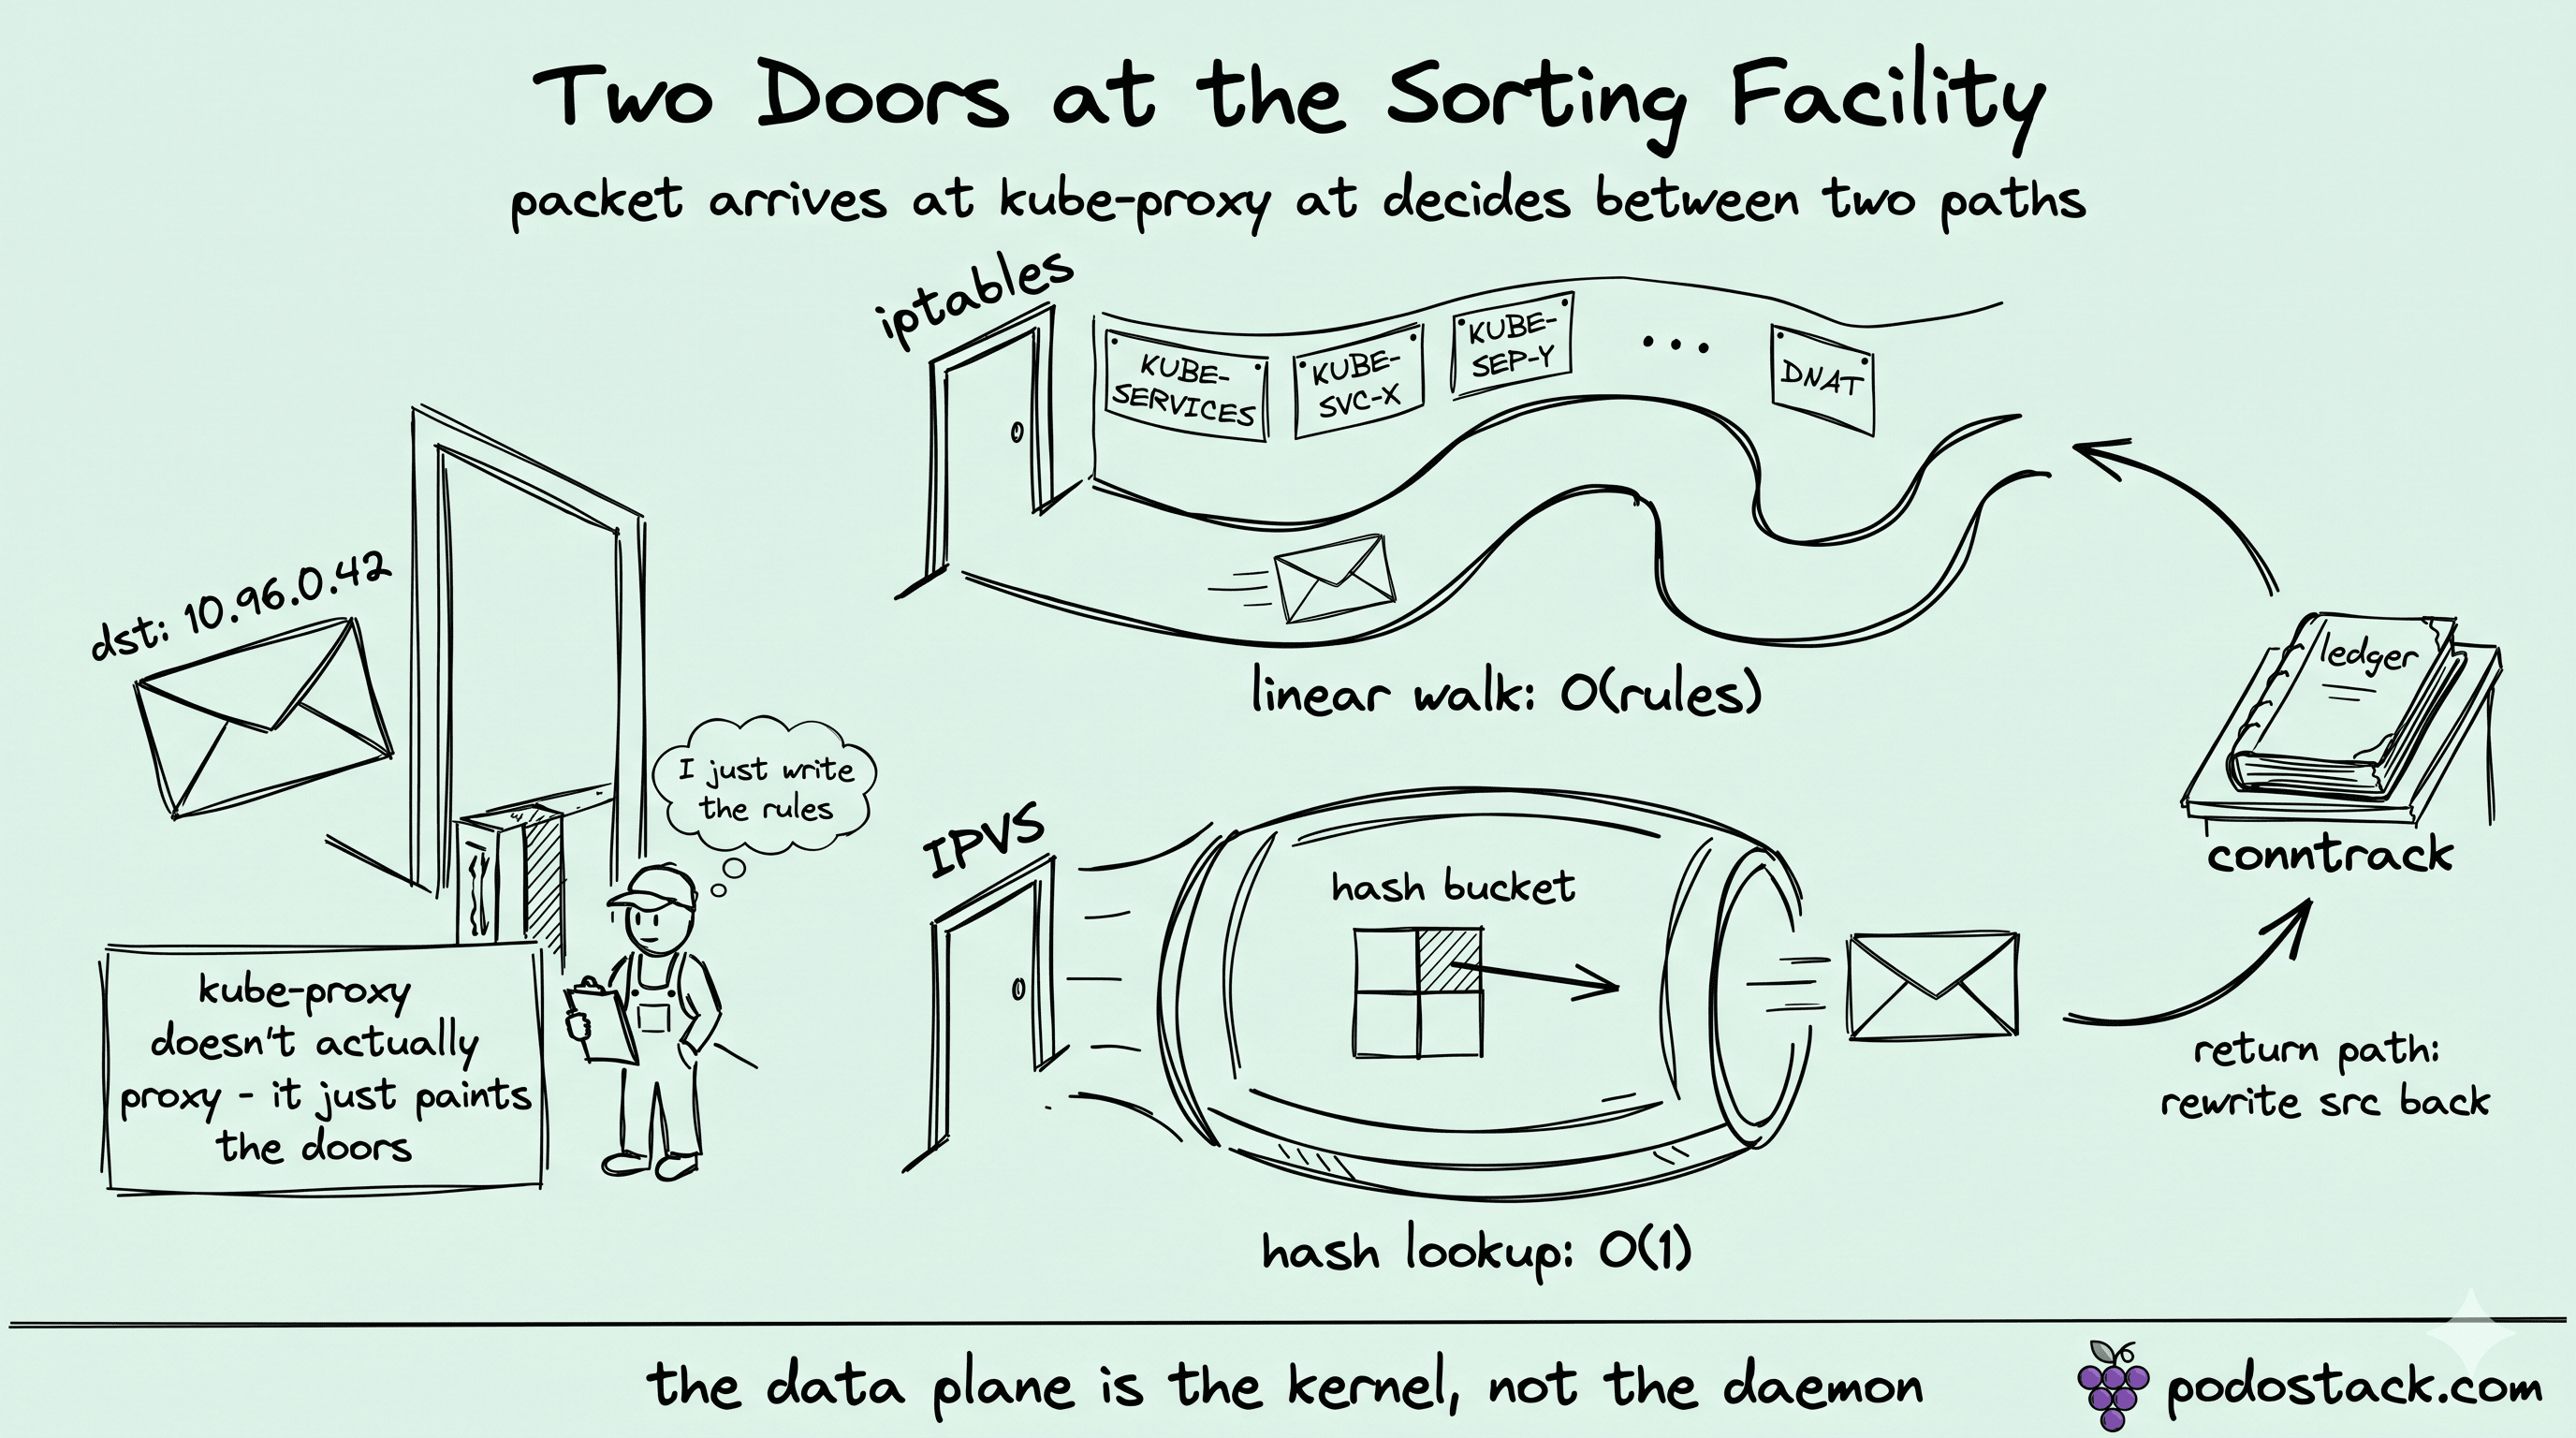
kube-proxy doesn't actually proxy. I'd been running Kubernetes clusters for several years before that fact lodged in my head as something operational rather than trivia. The name is a fossil from 2014, when the original implementation really did sit in userspace and shovel bytes between sockets. That mode (--proxy-mode=userspace) was deprecated a decade ago and removed entirely in 1.26. What survived the rename is the daemon's process name, but the job changed completely underneath it.
Today kube-proxy is a rule generator. It watches the API server for Services and EndpointSlices, then programs the kernel - iptables chains, IPVS tables, or now nftables sets - and steps out of the data path. Your packets never touch the kube-proxy process. They hit nf_tables or ip_vs directly and get rewritten in microseconds. kube-proxy just decides what the rules say.
That had been an abstract piece of knowledge for years - something I'd happily explain on a whiteboard in onboarding sessions. The Tuesday morning the Service stopped routing was the first time it cost me a couple of hours. The kube-proxy logs said nothing useful. The packet was breaking somewhere in nf_tables and the daemon that had configured those rules was already three reconcile cycles behind by the time I noticed.
The packet path under iptables mode
That afternoon I had iptables-save running on one screen and the Linux kernel netfilter docs open on the other. When you create a ClusterIP Service, kube-proxy in iptables mode writes a stack of netfilter rules into three custom chains: KUBE-SERVICES, KUBE-SVC-<hash>, and KUBE-SEP-<hash> (SEP = Service EndPoint).
I literally drew the walk on paper that afternoon because I needed it slow. A packet leaves a pod with dst=10.96.0.42 (the ClusterIP), hits PREROUTING, jumps to KUBE-SERVICES. That chain is a flat list, walked top to bottom matching on (clusterIP, port, protocol). On a match, the kernel jumps to the per-Service chain KUBE-SVC-XXX, which holds one rule per backend pod.
The piece I kept getting confused about was the probability math. Each rule inside KUBE-SVC-XXX is gated by a statistic mode random probability clause where the first rule fires with probability 1/N, the second with 1/(N-1), and so on. Once one fires, the kernel jumps to that endpoint's chain KUBE-SEP-YYY, which performs the DNAT (rewrites dst from the ClusterIP to the pod IP) and returns. After that the packet has a real pod address and routes out the node's CNI interface.
You can see all of this with iptables-save:
$ sudo iptables-save -t nat | grep KUBE-SVC- | head -3
:KUBE-SVC-NPX46M4PTMTKRN6Y - [0:0]
:KUBE-SVC-JD5MR3NA4I4DYORP - [0:0]
:KUBE-SVC-TCOU7JCQXEZGVUNU - [0:0]
Each KUBE-SVC-XXX is one Service. Each KUBE-SEP-YYY is one endpoint. Our cluster - about 4,000 Services with maybe six pods per Service on average - was carrying around 4,000 KUBE-SVC chains plus 24,000 KUBE-SEP chains, plus the master KUBE-SERVICES list with 4,000 entries in it. Every packet that hit a ClusterIP walked at least one chain linearly. By the time I was looking at it, that linear walk was costing us about 6% of a core per node - not a crisis, but enough that someone had pinned a graph of it to the team's whiteboard.
The return path is where it got interesting for me. When the SYN goes out, netfilter creates a connection-tracking entry: (src_pod_ip, src_port, dst_pod_ip, dst_port) plus the original ClusterIP it was rewritten from. When the reply comes back from the real pod, conntrack matches it and rewrites src back to the ClusterIP so the originating pod sees a coherent conversation. Without conntrack the asymmetric NAT just breaks TCP. None of this works if conntrack falls over. Hold onto that - it comes back later.
Why the migration broke
The other thing I learned that afternoon was rule reload. Every time an endpoint changes - a pod added, deleted, gone NotReady - kube-proxy regenerates its rule set and pushes the new set into the kernel. Before the iptables-restore optimisations in 1.20 and the incremental-sync work that followed, this was a serial rewrite of the entire ruleset. On a quiet cluster you don't notice. On our cluster doing a 50-replica rolling update during the IPVS migration window, kube-proxy was spending about fifteen seconds per node shuffling rules.
That was fifteen seconds where new connections were seeing stale endpoints. Some packets routed to pods that no longer existed and bounced. Some routed correctly. The unlucky ones got TCP resets, the really unlucky ones got partial responses, and a few got the kind of half-state where the client thought it had a connection and the backend had never heard of it.
That's what had broken those thirty Services. They weren't all broken. They were intermittently broken during the moment kube-proxy was catching up, and the percentage of intermittent failures was small enough that the cluster-wide error rate barely moved on our dashboards - but for any individual user it was sometimes 100%, depending on which retries landed inside the reload window.
IPVS mode mechanics
IPVS (IP Virtual Server) is the load-balancer that lives inside the Linux kernel - the same one that powers LVS, the load balancer that ran a lot of internet infrastructure long before Kubernetes existed. Its data structure is a hash table, not a chain, so lookup is constant-time regardless of how many Services you have. The constant-time lookup was the reason I'd planned the migration in the first place.
When you flip kube-proxy to --proxy-mode=ipvs, two things change. For each Service, kube-proxy creates an IPVS virtual service keyed on (ClusterIP, port, protocol). For each endpoint of that Service, it adds a real-server entry. The packet path becomes: pod sends to ClusterIP, kernel does the IPVS lookup, picks a backend by the configured scheduler, DNATs out. You inspect this with ipvsadm:
$ sudo ipvsadm -L -n
IP Virtual Server version 1.2.1 (size=4096)
Prot LocalAddress:Port Scheduler Flags
  -> RemoteAddress:Port           Forward Weight ActiveConn InActConn
TCP  10.96.0.42:80 rr
  -> 10.244.1.7:8080              Masq    1      4          1
  -> 10.244.2.11:8080             Masq    1      3          0
  -> 10.244.3.4:8080              Masq    1      2          2
The rr in that output is the scheduling algorithm. kube-proxy lets you pick from a handful - round-robin, weighted variants, least-connection, source/destination hashing - but on a normal day only two are worth thinking about in production. lc (least-connection) smooths out load when your endpoints have different capacity, which is the common case if you're running heterogeneous node types. sh (source hashing) gives you crude session affinity without needing cookies or Ingress configuration. Default rr is fine for everything else, and the weighted variants exist for specific cases you'll know when you hit them.
What kept biting me on the migration is something I'd skimmed past in the docs and only really learned at 11:30 that morning: IPVS doesn't replace iptables completely. kube-proxy still leans on netfilter for several auxiliary jobs that IPVS doesn't cover - egress source NAT, NodePort packet marking, the KUBE-FIREWALL chain dropping invalid packets - and keeps these rules compact with ipset (one set of ClusterIPs, one of NodePorts). iptables-save | grep KUBE on an IPVS-mode node returns fewer chains than iptables mode would have, but never zero.
In practice that meant my iptables -L debugging muscle memory became wrong overnight. The chains I was used to inspecting weren't there in any useful form. The data plane was in ipvsadm -L -n and ip route show table local, and I spent forty minutes that morning grepping iptables chains that no longer existed before someone on Discord nudged me toward ipvsadm.
Choosing between modes
For most clusters the question doesn't really come up. A 100-Service cluster runs the same on either mode and the difference is hard to measure. Where it started mattering for us - and probably for any team that runs Kubernetes at production scale long enough - was at the intersection of scale and churn.
Most production clusters in the world run iptables mode, and run it fine. A few hundred Services, modest endpoint churn, no exotic scheduler needs - that shape of cluster doesn't care which mode it's on. The mode has been the default since 2016, the tooling has been polished for nearly a decade, and any engineer who's run Kubernetes for more than six months can debug it cold from iptables-save output. The operational story is just simpler at that scale.
IPVS started making sense for us when scale and churn broke iptables' simplicity, not before. Tigera's benchmarks from a few years back showed rule-reload time growing roughly linearly with Service count in iptables and staying flat in IPVS. The crossover lands somewhere between 1,000 and 5,000 Services depending on kernel version. Past that point IPVS pulls ahead on rule-reload latency and on the operational cost of debugging a churn-heavy cluster where endpoints recreate every few seconds. The upstream Kubernetes docs at kubernetes.io/docs/reference/networking/virtual-ips/ cover the canonical mechanics if you want a second source.
Our cluster sat in the awkward middle: about 4,000 Services with namespaces deploying every few minutes. By the chart we should have benefited from IPVS, and eventually we did. The Tuesday told me more about staging than about modes. When we eventually redid the migration per-namespace with monitoring between batches, the breakage showed up at the first fifty Services and the rollout paused there for diagnosis instead of running blind to four thousand. Conntrack capacity got raised before the second flip too - IPVS generates connection patterns that stress conntrack differently than iptables had, and that part of the story came out of the original rollback rather than from the docs.
CPU on hot nodes was the other axis I'd been tracking. iptables burns CPU on packet processing during chain traversal and on kube-proxy itself during reloads; IPVS burns less on both, at the cost of a bit more memory for the hash tables. On a 1,000-Service shadow cluster I'd benchmarked beforehand, the gap measured at about 3% of a core per node - real but not dramatic. On the 4,000-Service main cluster the gap was bigger and would have repaid the migration cost. It just had to actually finish migrating.
There's a quieter dimension I didn't appreciate at the time, which is nftables availability at the OS layer. Older distributions still using iptables-legacy make iptables mode run slower than it needs to. Modern distros with the iptables-nft shim (iptables binary, nftables backend) close the gap to IPVS significantly without any cluster-level change. Our nodes were already on iptables-nft, which I should have read as a signal to question whether the IPVS migration was worth the operational complexity at all.
Mistakes I keep collecting
Since that Tuesday I've put together a short list of mistakes I keep hitting, mine and other teams', when kube-proxy modes change underneath someone.
Debugging IPVS clusters with iptables. This was my own mistake first. You switch the cluster to IPVS, hit a Service routing problem, and reach for iptables -L -t nat | grep KUBE-SVC- because that's the muscle memory. The chains aren't there. The data path lives in ipvsadm -L -n and ip route show table local. Build IPVS muscle memory or you'll spend an hour chasing chains that don't exist. I spent forty minutes that first morning. A team I helped with a similar incident a year later spent ninety minutes before someone on the call asked the right question.
Conntrack table bursting was the second thing that came up, on a different cluster about six months later. Both modes lean on conntrack. The table has a fixed size (nf_conntrack_max, default scales with RAM), and on a busy node with lots of short-lived connections - Ingress controllers talking to Services were our canonical case - the table can fill and packets start landing in dmesg as nf_conntrack: table full, dropping packet. We watched cat /proc/sys/net/netfilter/nf_conntrack_count over time and put a Prometheus alert at 60-70% of nf_conntrack_max:
$ sudo conntrack -L | wc -l
178432
$ cat /proc/sys/net/netfilter/nf_conntrack_max
262144
Once we sized the table up and shortened a few of the longer timeouts, the dropped-packet logs went quiet. The cluster that hosted our Ingress fleet was the one where this hit - post-IPVS the connection patterns had shifted underneath us in ways we hadn't predicted.
Mixed-mode confusion has bitten me twice now, which is exactly two times more than I'd like. kube-proxy mode is per-node, not per-cluster - if a mass IPVS rollout misses a handful of nodes that didn't restart kube-proxy (drained late, networking glitch during the rollout, whatever), the cluster ends up running two modes simultaneously. Both modes work in isolation. Debugging behaviour that depends on which node a connection landed on is painful, and traffic that hops between modes mid-migration produces error patterns that look nothing like normal failure modes. After the second time, our rollout checklist grew a line: confirm with kubectl get pods -n kube-system -o wide plus kubectl logs ds/kube-proxy before declaring the rollout done.
The last one I see frequently now is teams treating nftables mode like iptables mode because the syntax looks broadly familiar. kube-proxy gained a native nftables mode in 1.31, and while it's similar in spirit to iptables, the underlying ruleset format is the modern nftables one. Sets and verdict maps replace linear chain traversal with O(1) lookups. Rule and chain names sit far enough off the iptables originals that runbooks copy-pasted from older incidents stop working. The two teams I watched do 1.31+ upgrades both hit this within the first week - their iptables-savvy debugging tooling didn't port over.
Two years later
Looking back two years on, the migration story was less about iptables-vs-IPVS than it had felt at the time. I'd been thinking about kube-proxy as the data plane and it isn't. Once the question stopped being "chains or hash tables" and started being "what's the actual control loop telling the kernel to do, and how fast does it converge under failure modes I haven't tested", the rest of the work got noticeably less mysterious. The Tuesday morning rollback came from my mental model being wrong, not from anything IPVS did.
Kubernetes 1.31 shipped nftables as a beta proxy mode; 1.33 promoted it to stable. The shape is straightforward - kube-proxy stays as a rule generator, the iptables interface drops away, nftables rules go in directly. O(1) set lookups sit in the data structure now, which is what we feel during reloads on busy clusters. Incremental rule updates ride along too: kube-proxy no longer regenerates the whole ruleset on every endpoint change. The new clusters we've spun up since 1.33 default to nftables mode, and the rule-reload latency that drove our IPVS migration has stopped being something anyone graphs. iptables is officially in maintenance mode and nftables is the long-term direction for Linux packet filtering anyway, so the alignment is convenient.
And then there's the eBPF route. Cilium has been pushing kubeProxyReplacement: true for years, and the shape is simple: the Service-to-endpoint mapping lives in a BPF map, lookups are constant-time hash hits, no rule generator anywhere on the node. We ended up there two clusters later. The iptables-versus-IPVS conversation we'd had on that Tuesday simply stopped applying - no chains to traverse, no rules to reload, no ipvsadm to learn. By the time anyone asked which mode was faster, the answer for our team was "we run neither".