
PgBouncer modes: why your pool either leaks or deadlocks
process-per-connection cost, session vs transaction vs statement mode, pool_size math, prepared statements, advisory locks

At 02:11 the pager fired. The alert linked a dashboard that made no sense: CPU on the primary pinned at 100%, but the slow-query log was empty - not a single query over 40ms. The app dashboards showed timeouts everywhere, and pg_stat_activity had a little under five thousand rows. Almost all of them sat in idle or idle in transaction. The database wasn't slow. It was busy being five thousand processes, each holding ~10MB of private memory, fighting over the same handful of CPUs to do almost nothing. Someone had bumped the app's per-pod connection count "to handle the traffic spike", the deploy fanned out to forty pods, and forty times a generous local pool landed on a box that was happy up to about three hundred backends. We'd built a denial-of-service against ourselves with a config value.
That night is the whole argument for a connection pooler in one screenshot. Postgres doesn't degrade gracefully when you over-connect it - it falls off a cliff, and the cliff is made of operating-system processes.
Why a Postgres connection is expensive
Every connection to Postgres is a full OS process. The postmaster fork()s a new backend for each one - not a thread, not a lightweight coroutine, a process with its own address space. That fork has a fixed cost (catalog cache warm-up, prepared-statement state, per-backend memory) and a standing cost that never goes away while the connection lives. Reserve roughly 5-10MB of backend-private memory per idle connection before it has executed anything interesting, and more once work_mem allocations come into play for sorts and hashes.
The standing cost is the part that bites. A thousand idle connections aren't free just because they're idle. They're a thousand entries the scheduler considers, a thousand snapshots that GetSnapshotData has to scan when a transaction takes its snapshot, a thousand slots in shared structures. Older Postgres versions had a near-linear relationship between connection count and the cost of taking a snapshot, so adding idle connections slowed down the active ones. PG 14 reworked GetSnapshotData to scale with active rather than total connections and took a lot of the sting out of that specific path, but the per-process memory and scheduler pressure are still real on every version.
The practical ceiling is lower than people expect. A box that runs eight or sixteen vCPUs is genuinely happy somewhere around a few hundred active backends, and the useful number of connections doing CPU work at once is close to the core count. Set max_connections = 5000 and you haven't bought headroom, you've bought a loaded gun. The fix isn't a bigger number. It's stopping the app from holding a backend it isn't using, which is exactly what a pooler does: a small set of long-lived server connections, fronted by a cheap front door that thousands of clients can knock on.
Links
The three pool modes, and what each one breaks
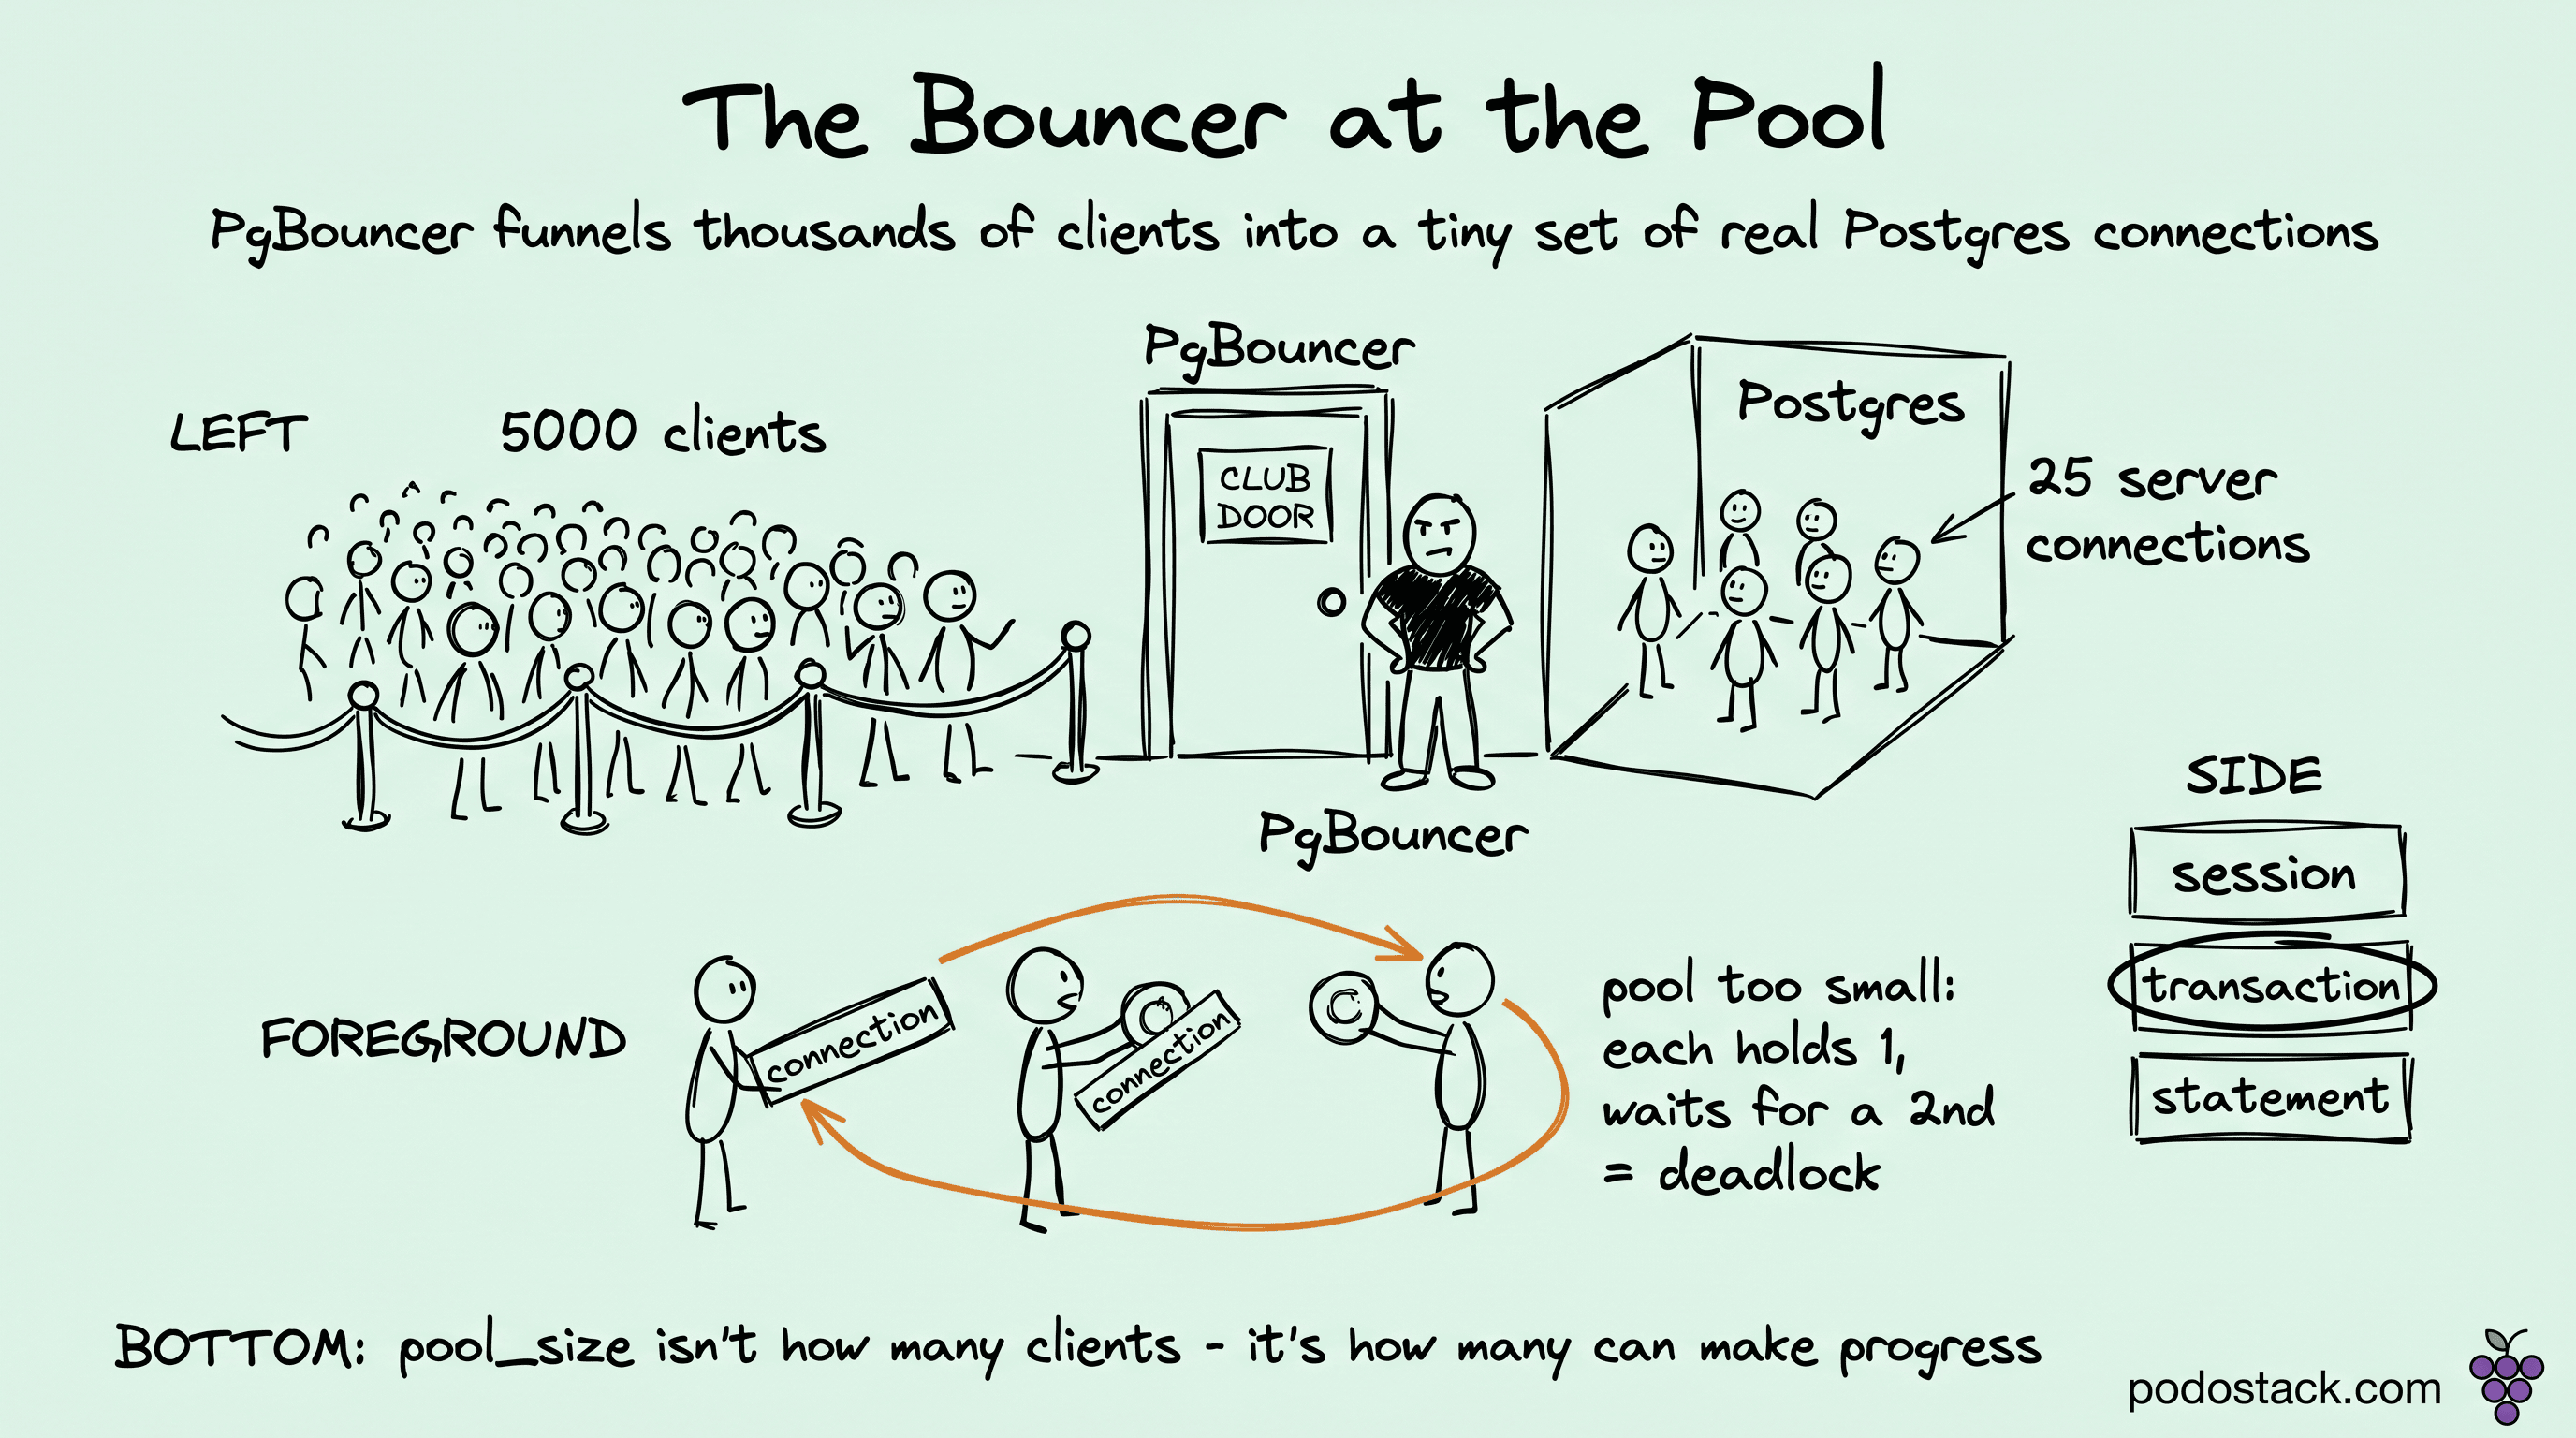
PgBouncer is a single-process, event-driven proxy. It speaks the Postgres wire protocol, holds a pool of server connections open, and hands them to clients. The whole behavior hinges on one setting, pool_mode, and the three values trade safety for efficiency in ways that are easy to get wrong.
Session pooling is the safe default and the one that saves you the least. A client connects, PgBouncer assigns it a server connection, and the client keeps that server connection until the client disconnects. Everything a raw Postgres connection supports works, because from the server's point of view there's still one client per backend for the whole session. The catch is obvious: if your app opens a connection at startup and holds it for the pod's lifetime, session pooling gives you no multiplexing at all. You've added a hop for nothing. Session mode helps when clients connect, do a burst of work, and disconnect.
Transaction pooling is the mode everyone actually wants and the one that quietly corrupts data when used wrong. A server connection is assigned to a client only for the duration of a transaction. The moment the transaction commits or rolls back, that backend goes back into the pool and the next client's transaction can land on it. This is what lets twenty thousand clients share fifty server connections. It works because most web requests are short transactions with long idle gaps between them.
What breaks in transaction mode is everything that assumes session continuity across transactions. A server-side SET you expected to persist is gone, because the next query runs on a different backend. The same dropped continuity kills LISTEN/NOTIFY, since the channel subscription lives on a backend you no longer own. Session-level advisory locks (pg_advisory_lock) are worse than gone - they're a trap, because you acquire the lock on one backend and the unlock call may land on another, leaking the lock forever. WITH HOLD cursors that outlive a transaction don't survive either. And historically the nastiest one was protocol-level prepared statements: you PREPARE on one backend and EXECUTE on another that never saw the prepare. The dangerous part is that none of these throw a loud "you can't do this in transaction mode" error. They just do the wrong thing, intermittently, depending on which backend the pooler happened to hand you.
The prepared-statement story has actually improved. PgBouncer 1.21 (late 2023) added support for protocol-level prepared statements in transaction mode through max_prepared_statements, which defaults to 0 (off). Set it above zero and PgBouncer tracks named prepared statements per client and re-prepares them on whatever backend it routes you to, keeping an LRU cache per server connection. It's a genuinely good feature and it removed the single most common transaction-mode footgun. Two caveats worth knowing: it only covers protocol-level prepares (libpq PQprepare and the extended query protocol), not text-level PREPARE foo AS ... SQL, which PgBouncer can't see; and it does nothing for the other session features. SET, LISTEN, advisory locks, and WITH HOLD cursors are still broken in transaction mode no matter what max_prepared_statements is.
Statement pooling is the most aggressive and the rarest. The server connection is released back to the pool after every single statement, which means multi-statement transactions are simply forbidden - PgBouncer enforces autocommit and errors if you try to open a transaction. It exists for workloads that are genuinely one-shot per statement, and almost nobody runs it on purpose. If you find yourself in statement mode, it's usually because you copied a config and didn't read it.
Links
pool_size, max_client_conn, and the backends in between
Three numbers, three different things, and the deadlock comes from conflating them.
The cheap one is max_client_conn: how many clients can be connected to PgBouncer at once. Each idle client connection inside PgBouncer costs a few kilobytes, not a backend, so this goes into the tens of thousands without trouble. It's the front door, and it's wide on purpose.
Where the cost actually lives is default_pool_size (or per-database pool_size), the number of server connections PgBouncer opens per user/database pair - each one a real Postgres backend. The whole point of the pooler is that this stays small, dozens not thousands. I usually start near the CPU core count plus a little and tune from there. The sum of all your pools across all PgBouncer instances has to comfortably fit under the database's max_connections, with room left for reserved_connections and your own superuser sessions when things go wrong at 2am.
Here's a minimal pgbouncer.ini that shows the shape of it:
[databases]
appdb = host=10.0.0.5 port=5432 dbname=appdb

[pgbouncer]
listen_addr = 0.0.0.0
listen_port = 6432
auth_type = scram-sha-256
auth_file = /etc/pgbouncer/userlist.txt

pool_mode = transaction
max_client_conn = 10000
default_pool_size = 25
reserve_pool_size = 5
reserve_pool_timeout = 3
max_prepared_statements = 200
server_idle_timeout = 60
Ten thousand clients fan into twenty-five backends per pool. The database sees twenty-five connections doing real work, not ten thousand processes sitting idle.
The deadlock hides in pool_size when a single logical operation needs more than one server connection at the same time. Say each unit of work opens a transaction on appdb, and partway through it opens a second connection to the same pool - a side query, a different ORM session, a "let me just check this other table" call - while still holding the first. Now pool_size = 25 means twenty-five units of work can each grab their first connection, and then all twenty-five sit there waiting for a second connection that will never come, because every backend in the pool is held by a transaction that's blocked waiting for a backend. Classic resource deadlock. The pool drains, cl_waiting climbs, and every request times out at once, which from the outside looks exactly like the database died. It didn't. Your concurrency model needed two backends per unit of work and the pool could only ever hand out one each.
Links
Where to put it
Sidecar (one PgBouncer per app pod or host). Lowest latency, the pooler shares the failure domain of the app, and each instance's pool is tiny. The trap is the multiplication you already saw in the incident: if every one of forty pods runs pool_size = 25, the database sees up to a thousand backends. Sidecar pooling means dividing your global backend budget by the pod count, and that division is the thing teams forget when they scale the deployment.
Central (a dedicated PgBouncer tier in front of the database). One place to reason about the total backend count, one place to fail over, clean math: pool_size is the global pool. The cost is an extra network hop and a new thing that can fall over, so this tier wants its own redundancy. PgBouncer is single-process and single-threaded, so a busy central tier saturates one core and you scale it by running several instances behind a load balancer, each with its own slice of the pool budget.
Per-node (a PgBouncer on every Kubernetes node, app pods connect to localhost). A middle ground that bounds the multiplication to node count instead of pod count, which is usually a much smaller and more stable number. This is where a lot of larger setups land.
There's no single right answer, but there is a right discipline: write down the worst-case total backend count across every PgBouncer instance you run, and confirm it's under max_connections. If you can't compute that number from your config, you're one scale-up away from the 02:11 page.
Picking a mode without guessing
The way I land on a mode is to start from what the application actually does to a session, then take the loosest mode that doesn't break it.
For the standard web/API shape - short transactions with idle gaps, and either no session features or the few that exist routed elsewhere - transaction mode is the answer almost every time. That's where the multiplexing payoff lives, which is most of the reason to run a pooler at all.
Session mode is what I keep for the apps that genuinely lean on session continuity and can't be changed: heavy LISTEN/NOTIFY, session advisory locks held across transactions, server-side SET that has to persist, WITH HOLD cursors. That's a correctness call, not laziness. You give up multiplexing, but nothing gets silently corrupted.
There's a middle path I've used when ninety percent of traffic is transaction-mode-safe and a thin slice needs sessions: run two pools, or two PgBouncer endpoints with different pool_mode, and point the listener and advisory-lock code at the session-mode one. Mixing modes on purpose beat forcing everything into a single mode every time I tried it.
And the number that catches people - size pool_size from the database's CPU and your concurrency model, never from client count. Client count belongs to max_client_conn, which is nearly free. The expensive number tracks how many queries can usefully run at once, closer to core count than to user count. If a single request grabs two backends, effective parallelism is pool_size / 2, so you either raise pool_size with budget to back it or fix the code so one request holds one backend.
Failure modes that keep showing up
Once a pooler sits in the path, the same handful of failures keep recurring - mostly transaction-mode breakage and pool sizing. I've debugged most of these firsthand.
Session advisory locks under transaction mode. The lock gets taken on one backend and released on another, so it leaks until that backend recycles. What you see is locks that never clear and a
pg_lockstable slowly filling with orphans nobody can explain.Then there's the
SETthat's expected to stick. YouSET statement_timeoutor a search_path at connect time, it passes in dev because dev only ever has one backend, and in prod it applies to a random backend you don't keep. Wrap session-scoped settings inSET LOCALinside the transaction instead.Pre-1.21 PgBouncer paired with an ORM that uses protocol-level prepared statements in transaction mode is its own special pain. The newer Postgres drivers prepare by default, the prepare lands on one backend, the execute on another, and you get "prepared statement does not exist" under load and never in testing. Upgrade and set
max_prepared_statements, or disable prepares in the driver.Sizing
pool_sizefrom client count is the one I see most. Someone reads ten thousand users and setspool_size = 10000, recreating the exact problem the pooler was meant to solve. The pool is the expensive number and it stays small.Sidecar pooling without dividing the backend budget by pod count gets people on the scale-up: every pod's pool looks reasonable in isolation, and the sum melts the primary. Multiply before you ship.
Forgetting
server_idle_timeoutleaves the pool holding its fullpool_sizeof backends open forever, even at 3am when traffic is nothing. Idle server connections still cost backend memory; let the pool shrink when it's quiet.And the assumption that PgBouncer is highly available because it's "just a proxy". It's a single process. If it dies, every client behind it loses the database at once. The pooler needs the same redundancy thinking as the database it fronts.
We never did see a single slow query that night. The database hadn't been doing too much real work - it was drowning in processes doing nothing, five thousand backends each holding their 10MB and their slot, fighting over the cores to be idle. The pooler we put in after made the backend count a number we picked on purpose, instead of one that fell out of replicas times per-pod connections. The worst-case total across every instance now lives in a comment at the top of the config, and it sits under the line.