
Your Prometheus Bill Isn't Prometheus. It's Cardinality.
FinOps for observability: measure, attribute, and aggressively drop the metrics you don't need

Prometheus is free. Thanos is free. Grafana is free. And yet the observability line item on your cloud bill keeps climbing. Compute for the query path, memory for the head block, S3 for long-term storage, egress charges when dashboards span clusters - the tools are open source but the infrastructure around them is very much not.
The thing nobody tells you when they hand you a Prometheus stack is that the cost driver is almost never “more metrics.” It’s cardinality. The number of unique time series - not raw data points, not storage bytes - is what determines how much RAM your Prometheus needs, how fast your queries are, and how much you pay S3 every month.
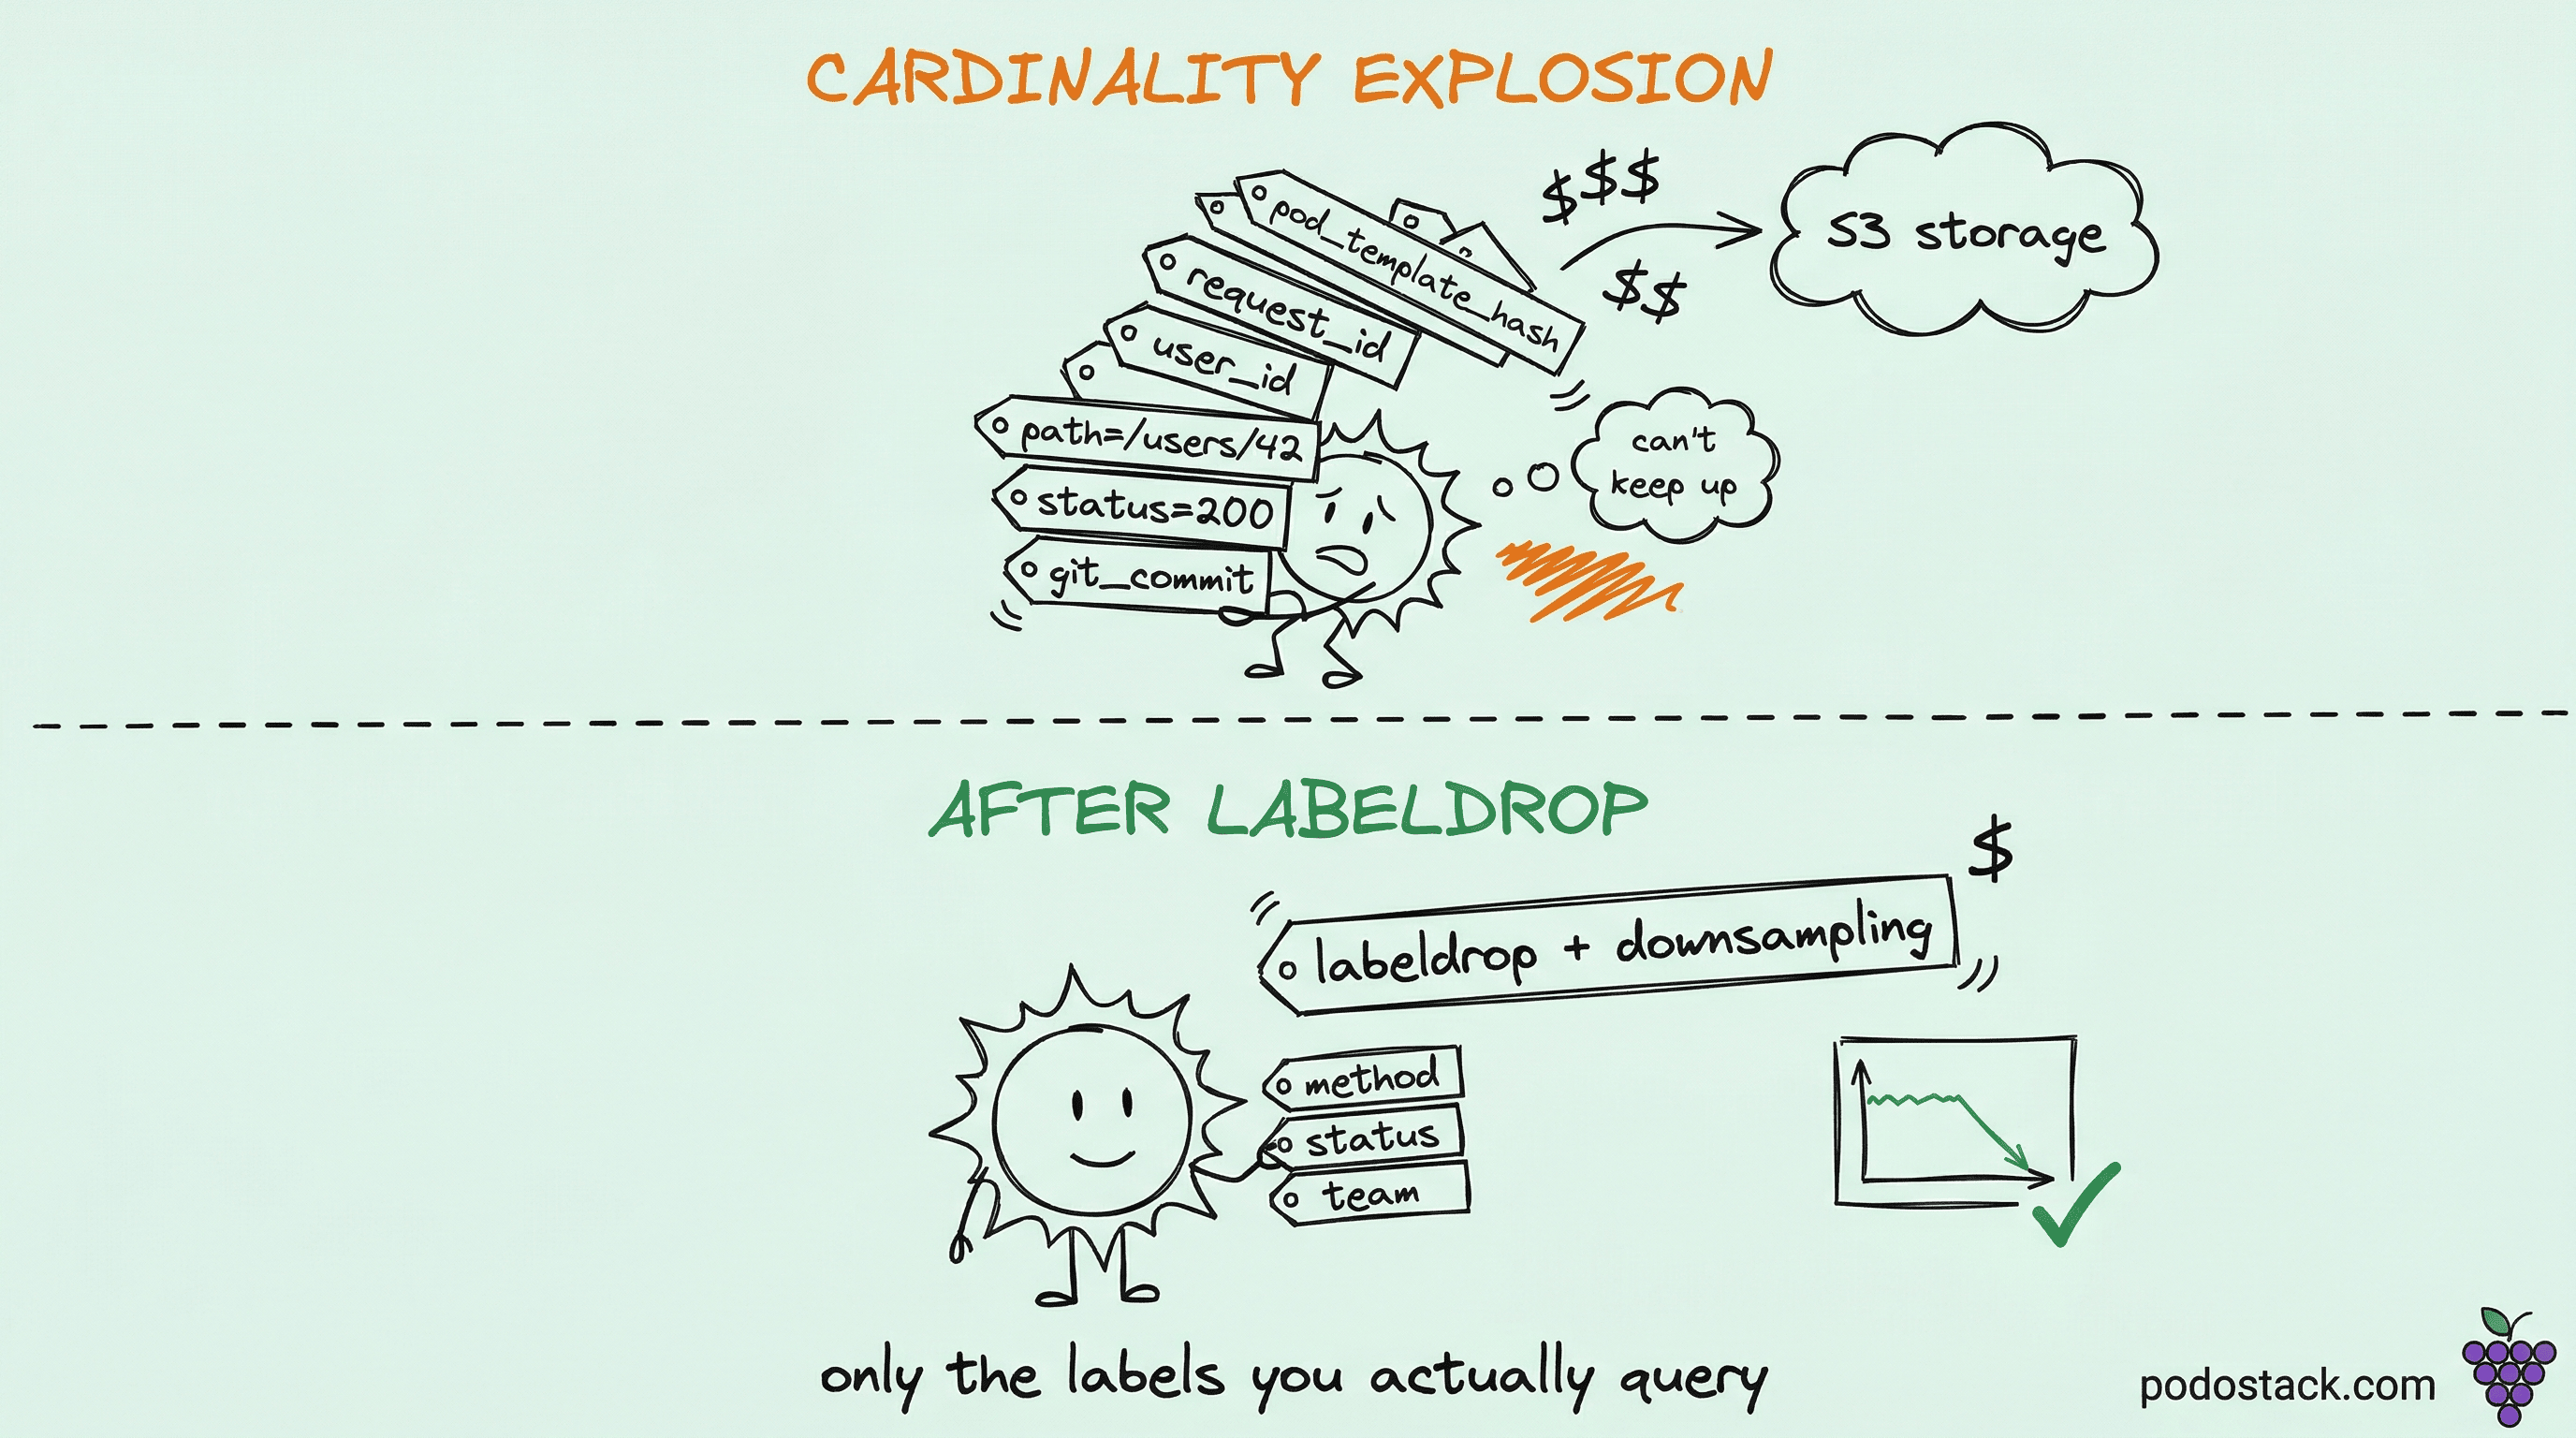
And cardinality explodes quietly. A developer adds a pod_template_hash label to track which deployment version a metric came from. Another adds request_id because they wanted to trace something. A third exports a Go runtime metric with the goroutine ID as a label. Each of these looks innocent locally. Together they can 100x your series count over a quarter.
Step 1: find the metrics that are eating you alive
Prometheus can tell you exactly which metrics are the worst offenders. Run this against your Prometheus or Thanos Querier:
topk(20, count by (__name__)({__name__!=""}))This ranks metric names by how many time series they produce. The top 20 usually contains 80% of your total series count. Write down the names.
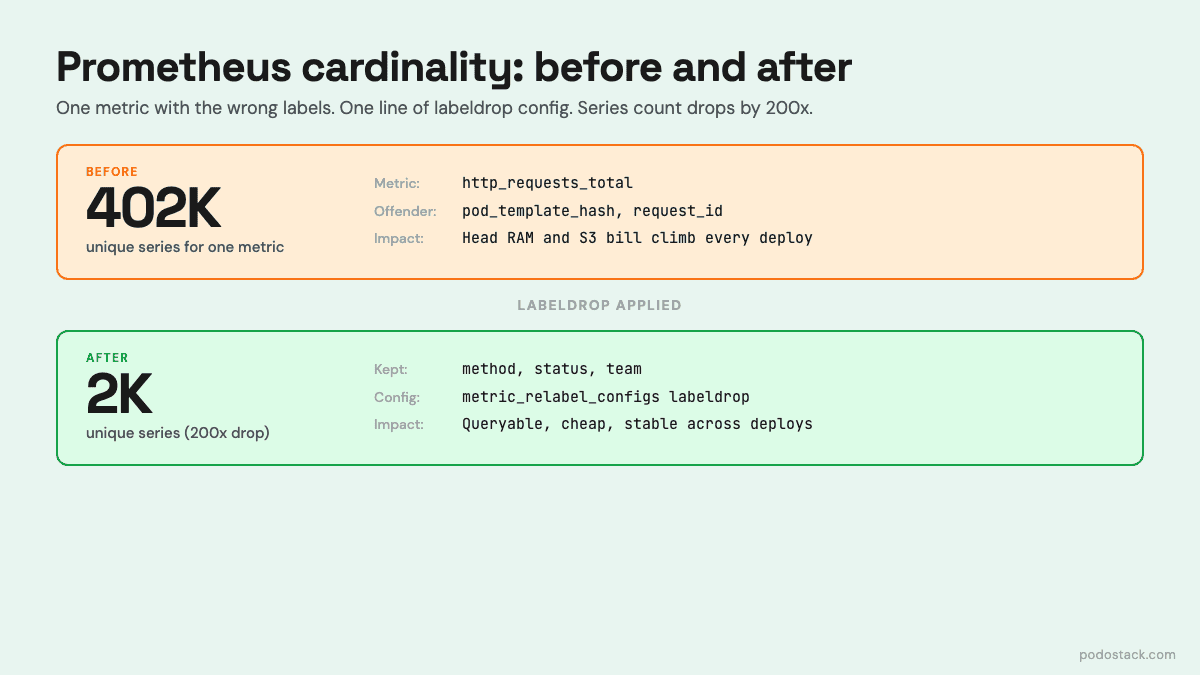
Then drill into the worst one. Say http_requests_total is at the top with 400,000 series. Which label is blowing it up?
topk(10, count by (pod)({__name__="http_requests_total"}))
topk(10, count by (path)({__name__="http_requests_total"}))
topk(10, count by (status_code)({__name__="http_requests_total"}))
One of these breakdowns will reveal the offender - usually a high-cardinality label that shouldn’t exist. Common culprits: a path label that contains user IDs, a user_id label that contains user IDs, a pod_template_hash that changes every deploy, a request_id that changes every request. Each of these turns a reasonable 50-series metric into a 50,000-series metric.
Histogram metrics (the ones ending in _bucket) deserve their own investigation. Each bucket is a separate series, so a histogram with 10 buckets and 100 label combinations is already 1,000 series before you add anything.
Step 2: attribute the cost to the team that created it
Once you know where the series are, the next question is who owns them. “We spent $3,200 on observability last month” is not an actionable number. “Team alpha spent $1,400, team bravo spent $900, team charlie spent $300” is.
The pattern is to require a team label on every metric. You can enforce this in two ways:
In the application. Your metrics library adds a team label at registration time, pulled from an environment variable that your deployment pipeline sets. Every metric from that service inherits the label. This is the cleanest but requires changes in every service.
At the scrape layer via relabel_configs. Your ServiceMonitor or scrape config reads a teamlabel from the pod annotations and copies it onto every metric from that pod. No code changes required.
Once you have the label, you can query cost-relevant breakdowns:
# Hot series in memory, by team
sum(prometheus_tsdb_head_series) by (team)

# Ingestion rate (samples per second), by team
sum(rate(prometheus_tsdb_head_samples_appended_total[5m])) by (team)
Make these dashboards public. The moment a team sees its own line on a “monthly observability cost per team” chart, conversations about cardinality get much easier.
Step 3: downsample aggressively with Thanos
Raw resolution data - one sample every 15 seconds - is useful for about 30 days. After that, nobody is debugging a specific incident at second-level granularity; they’re looking at trends. Thanos Compactor can aggregate your data into coarser resolutions as it ages:
args:
  - --retention.resolution-raw=30d
  - --retention.resolution-5m=1y
  - --retention.resolution-1h=5y
  - --downsampling.disable=false
This is roughly equivalent to saying “keep 30 days of raw data, then 5-minute rollups for a year, then hourly rollups for 5 years.” For storage purposes, 5-minute resolution cuts your sample count by 20x compared to 15-second raw data. Hourly resolution cuts it by another 12x on top of that.
Your long-retention S3 bill gets a lot cheaper. Your queries over long time windows also speed up dramatically - rate(errors[90d]) no longer has to scan 518,400 raw samples per series, it scans 26,000 5-minute samples.
Step 4: drop the labels you don’t query
The most underused optimization is metric_relabel_configs with action: labeldrop. This strips a label at scrape time, before anything is written to storage. Series that differ only in that label collapse into one.
metric_relabel_configs:
  - action: labeldrop
    regex: pod_template_hash
This one line, on a busy cluster, can cut your series count by a factor of 5. Every time a deployment rolls out, pod_template_hash changes, and if nothing drops it, every metric from that deployment becomes a new set of series. The old series don’t delete - they just stop receiving samples and linger in storage until they age out.
Other common drops: instance_id if you don’t need per-instance granularity, git_commit if you’re exposing it as a label (make it an info metric instead), any label whose value is a random string.
The rule I use: if a label has never been in a by() clause in any query I’ve actually run, it should be dropped at ingestion. Measure your query log for a month and you’ll be surprised at how few labels are actually used.
Making this a continuous process
Cardinality control is not a one-time cleanup. New services get added. Old services grow new metrics. Labels drift. The only way to keep it from regressing is to make cardinality visible, reviewed, and owned.
The minimum setup that actually works:
A dashboard showing total series count over time, broken down by team and metric name.
An alert that fires when a single metric crosses 100,000 series, or when total series grow by more than 10% week-over-week.
A
relabel_configsallowlist or denylist that’s reviewed as part of every new service onboarding.A monthly “cost per team” report sent to engineering leads.
None of this is hard. All of it is unglamorous. The teams that skip it end up with observability bills that look like a runaway data warehouse - and the solution is never “buy more storage,” it’s always “stop writing data nobody reads.”
If your Prometheus memory usage climbs every week and nobody knows why, start with topk(20, count by (__name__)({__name__!=”“})) - you’ll find the offender in five minutes.