
eBPF Beyond Networking
Tetragon runtime enforcement, Parca continuous profiling, Falco vs Tetragon showdown, Sloth SLO automation, and Grafana Alloy

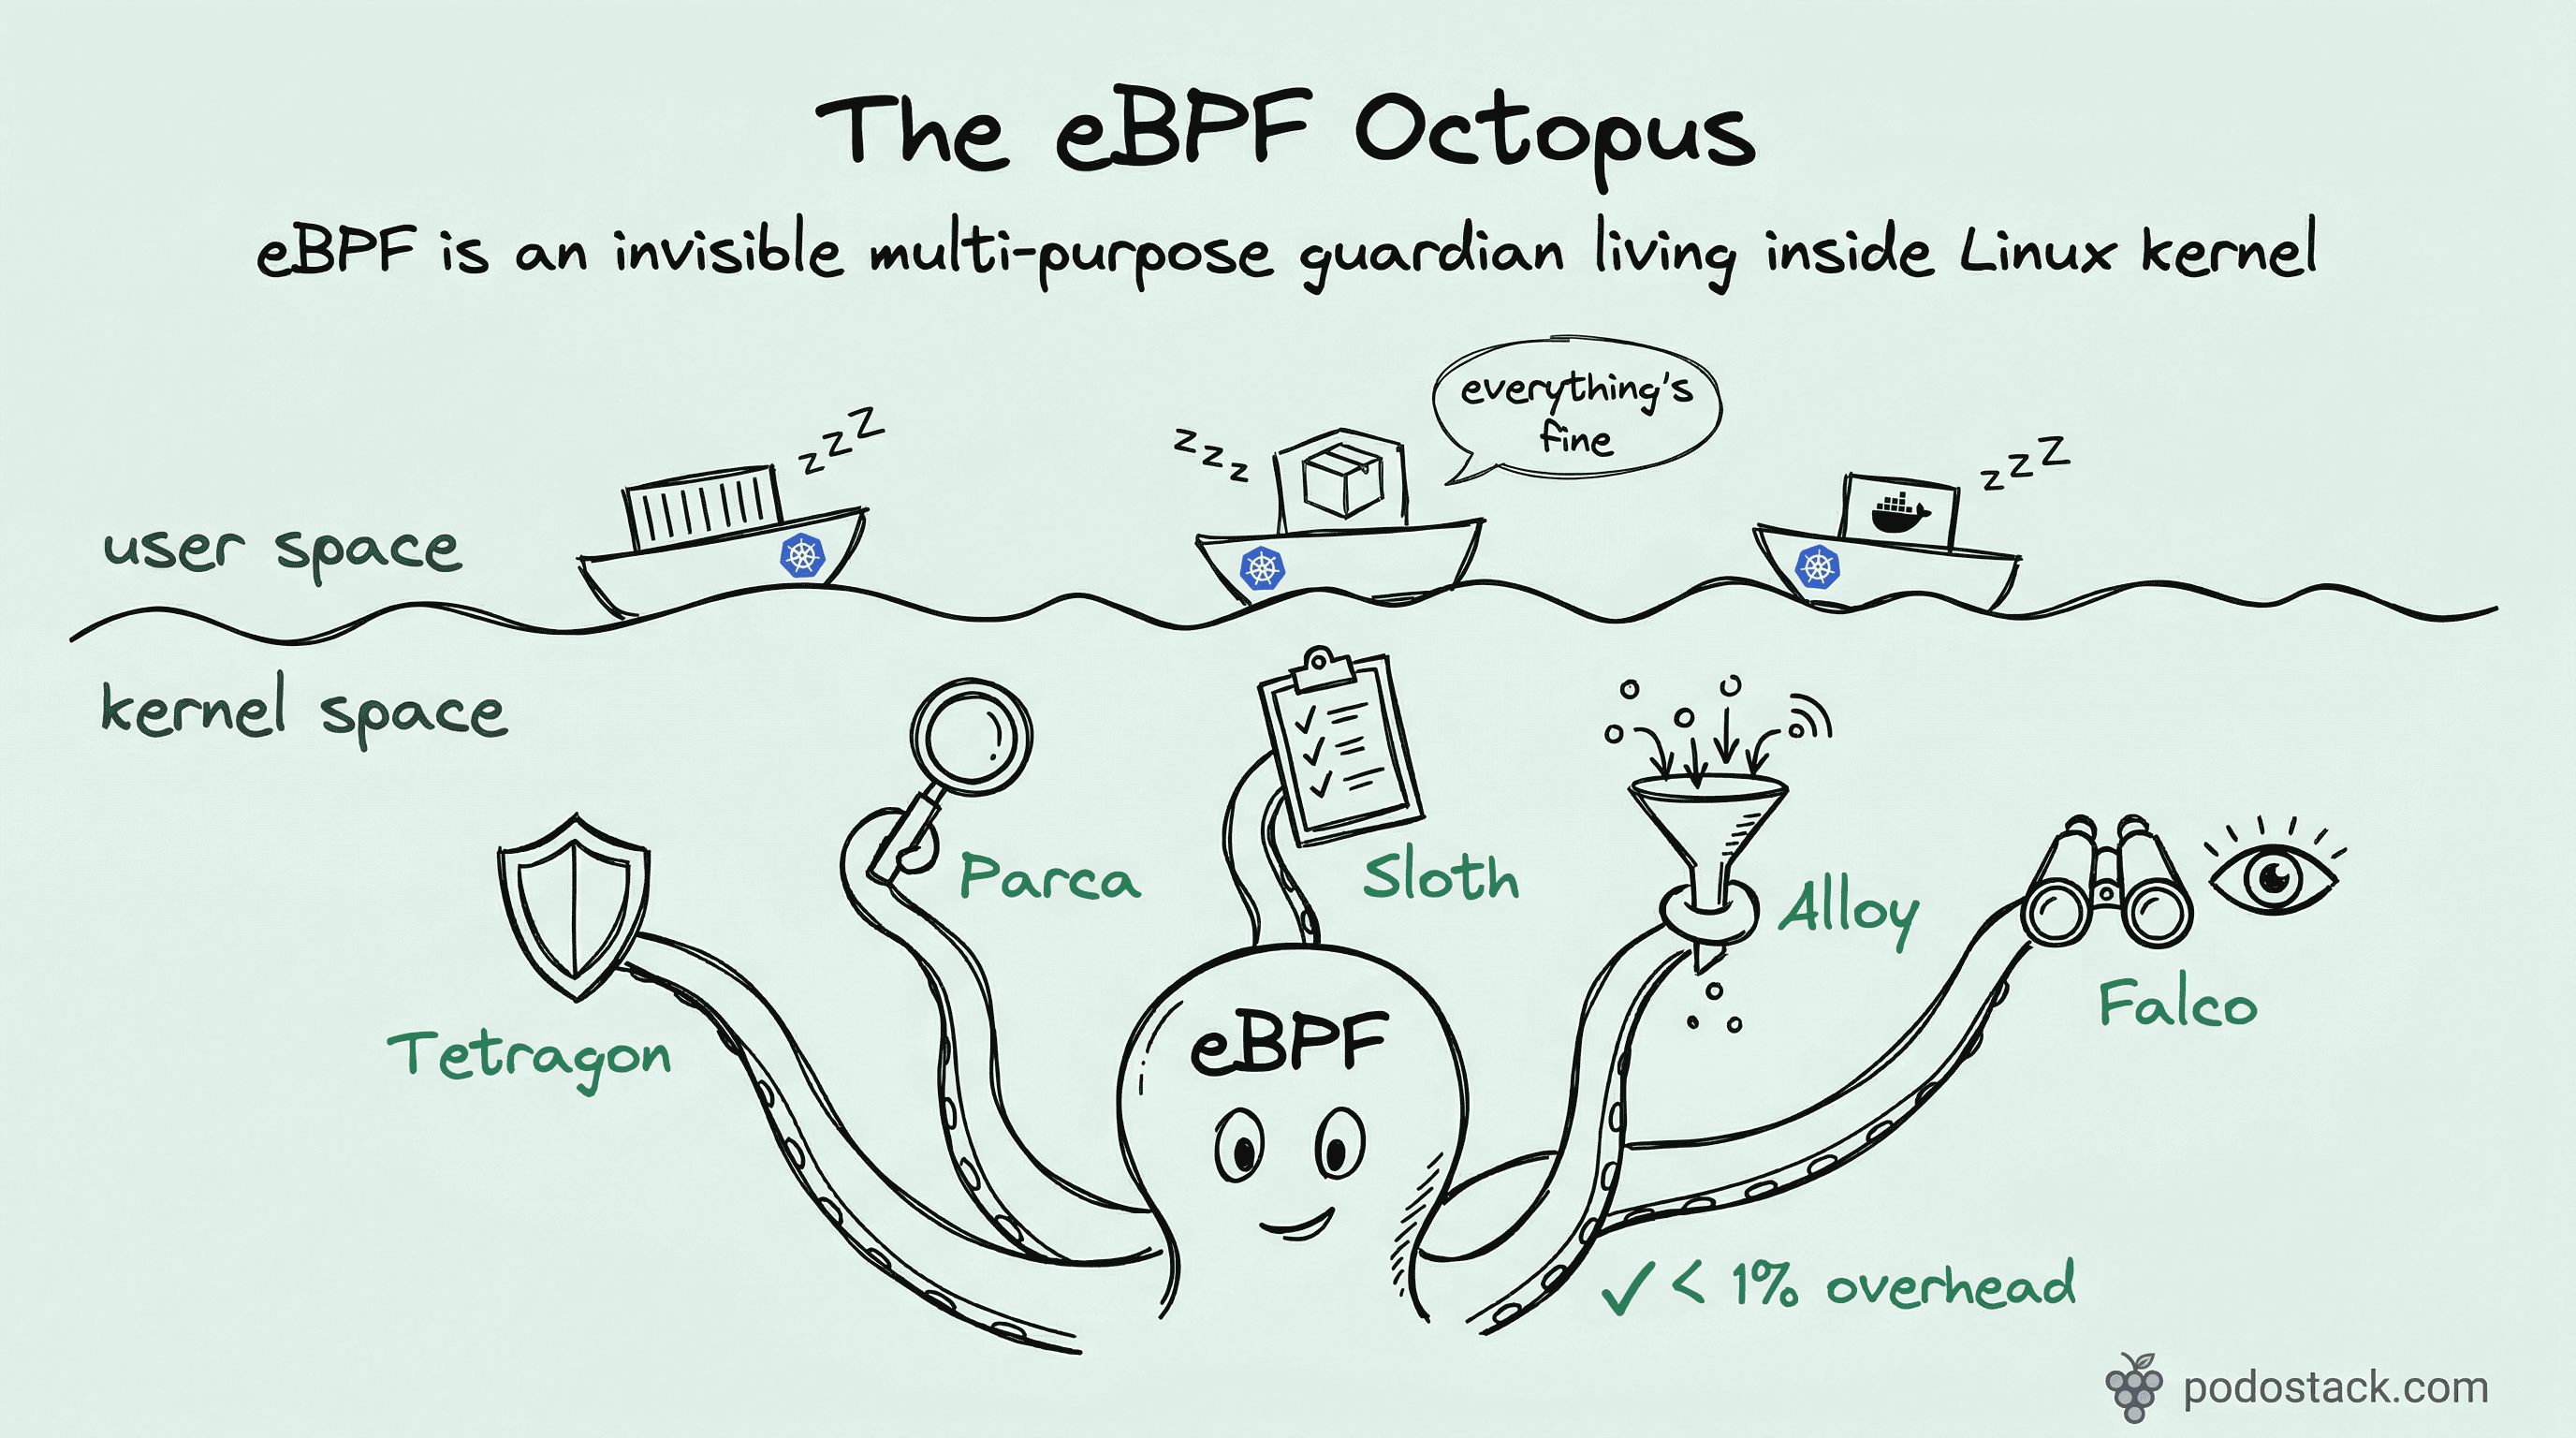
Welcome back to Podo Stack. In Issue #9 we covered Cilium - eBPF rewriting the network layer. But networking is just one tentacle. This week: five tools that push eBPF into security, profiling, and reliability.
Here’s what’s good this week.
🚀 Sandbox Watch: Tetragon - Kill It at the Kernel
The problem
Your container just spawned a shell. You know about it 30 seconds later because Falco sent an alert to Slack. By then, the attacker already read /etc/shadow and opened a reverse shell. Detection is nice. Prevention is better.
The solution
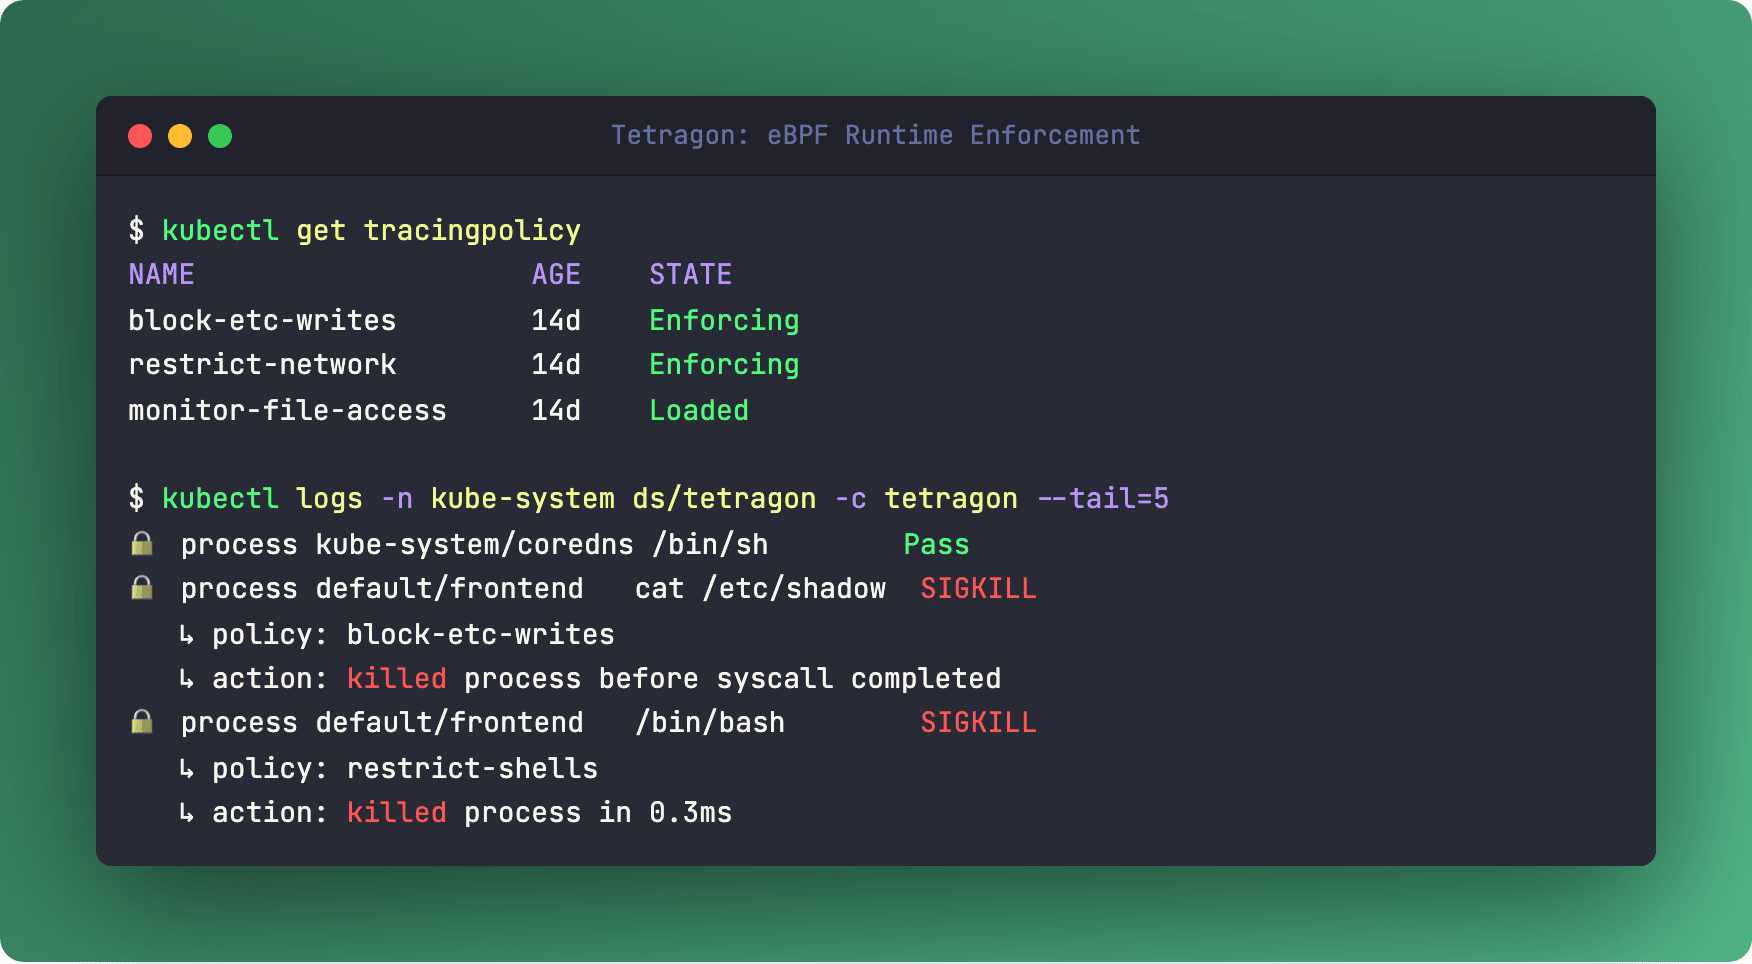
Tetragon doesn’t just watch syscalls - it blocks them. Right there in the kernel. Before the call even completes.
Built by the Cilium team (Isovalent, now Cisco), Tetragon hooks into the Linux kernel via eBPF and enforces security policies at the deepest level possible. When a process violates a rule, Tetragon sends a SIGKILL before the syscall returns. No round-trip to userspace. No window for TOCTOU attacks.
And because it runs in the kernel, the overhead is below 1%. No sidecar, no agent eating your CPU.
What makes it special
Tetragon is Kubernetes-aware by default. It maps low-level kernel events to pods, namespaces, and service accounts. You write policies like “block writes to /etc for pods labeled app: frontend“ - as CRDs, not Lua scripts.
Recent additions make it even more serious: persistent enforcement continues working even if the Tetragon agent restarts. And redaction filters strip passwords and tokens from event logs right in the kernel.
The catch
Tetragon requires Linux 5.x+ with BTF support. Most modern distros have this, but old AMIs or custom kernels might not. Check before you deploy.
Links
💎 Hidden Gem: Parca - Profile Everything, All the Time
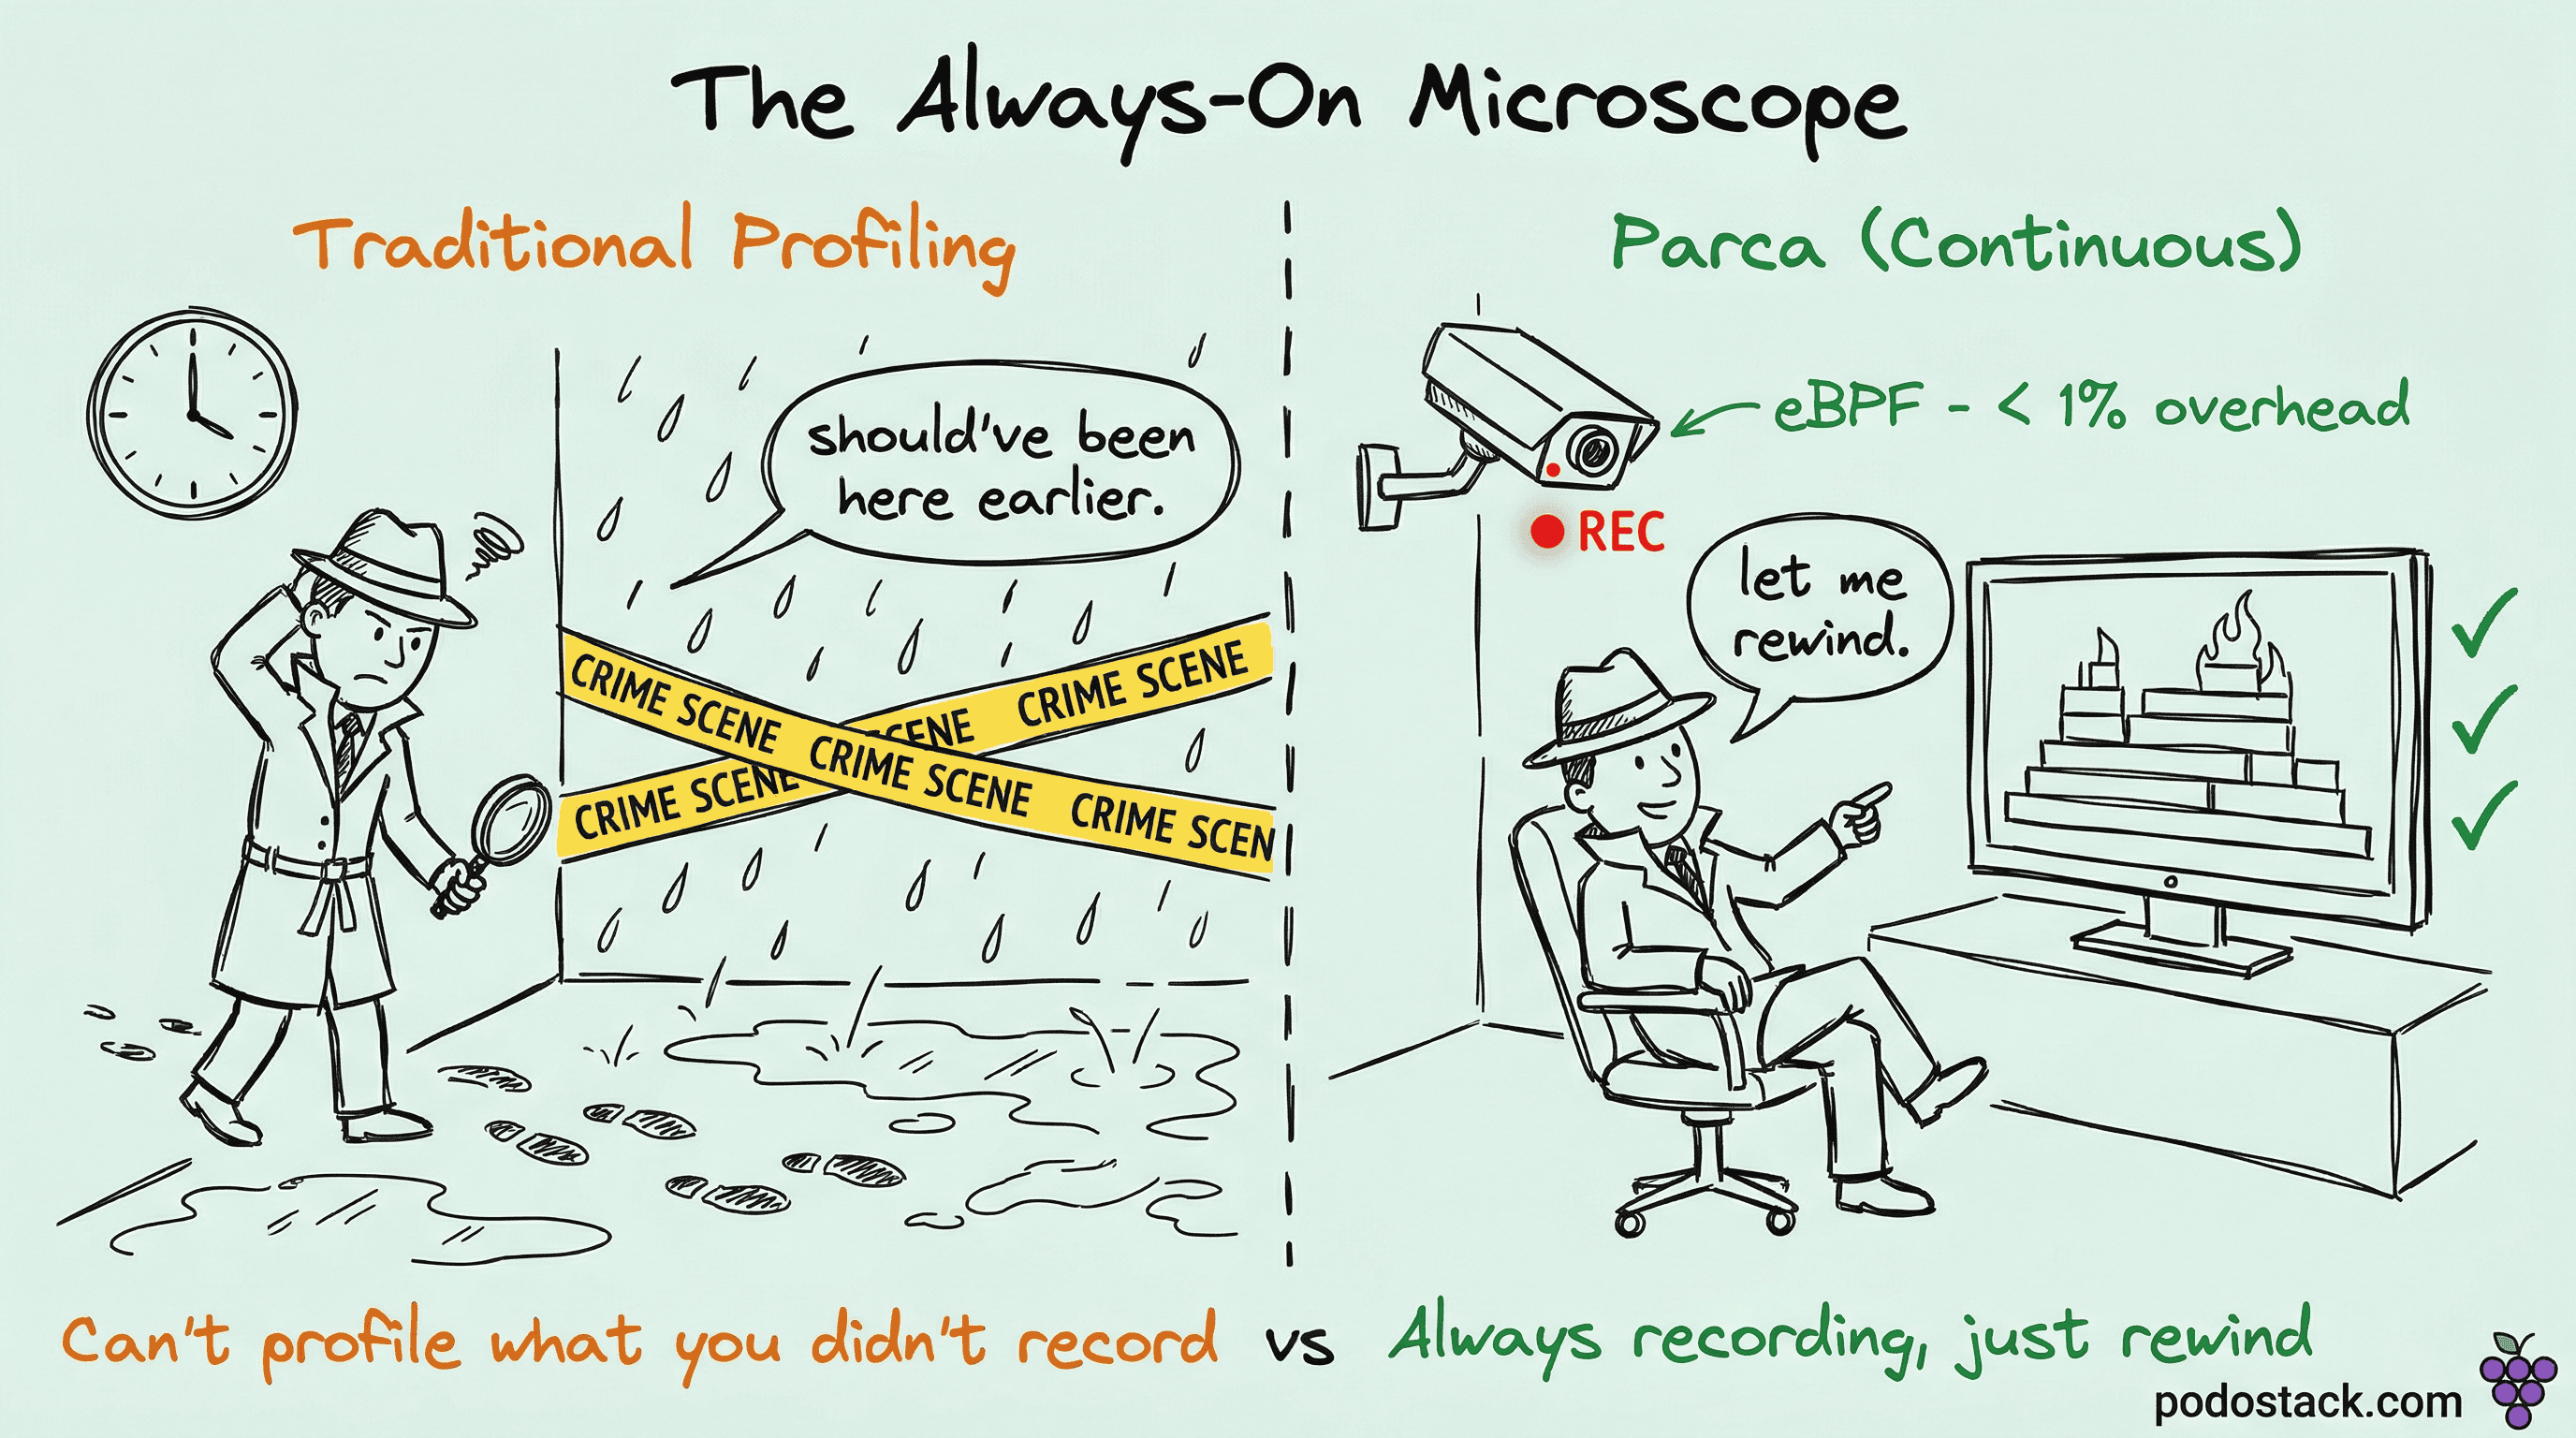
You profile your app when something’s slow. But by the time you attach a profiler, the problem is gone. Parca flips this: it profiles your entire cluster, continuously, with less than 1% overhead.
How it works
Parca uses eBPF to sample stack traces at the kernel level. No code changes. No library imports. No restarts. It works across C, C++, Rust, Go, Python, Java, and Node.js - anything that runs on Linux.
Collected profiles go into FrostDB, a columnar database purpose-built for profile data. Then you get flame graphs, icicle charts, and - the killer feature - differential profiling. Compare Tuesday’s deployment to Monday’s. See exactly which function started eating more CPU. No guessing.
Why this matters
Traditional profiling costs 10-30% overhead. You’d never run it in production. Parca costs less than 1%, so it runs everywhere, always. When an incident hits at 3 AM, the profile data is already there.
Three practical wins: catch hotspots that waste cloud spend, find memory leaks in real time, and get instant post-mortems without “we should’ve had a profiler running.”
Parca vs Pyroscope
Pyroscope joined Grafana Labs and focuses on SDK-based profiling with broader language support. Parca stays pure eBPF - zero instrumentation, Kubernetes-native CRDs, CNCF sandbox project. If you’re already in the Cilium/eBPF world, Parca fits naturally.
Links
⚔️ The Showdown: Falco vs Tetragon
Both watch syscalls. Both protect your cluster. But they disagree on what to do about it.
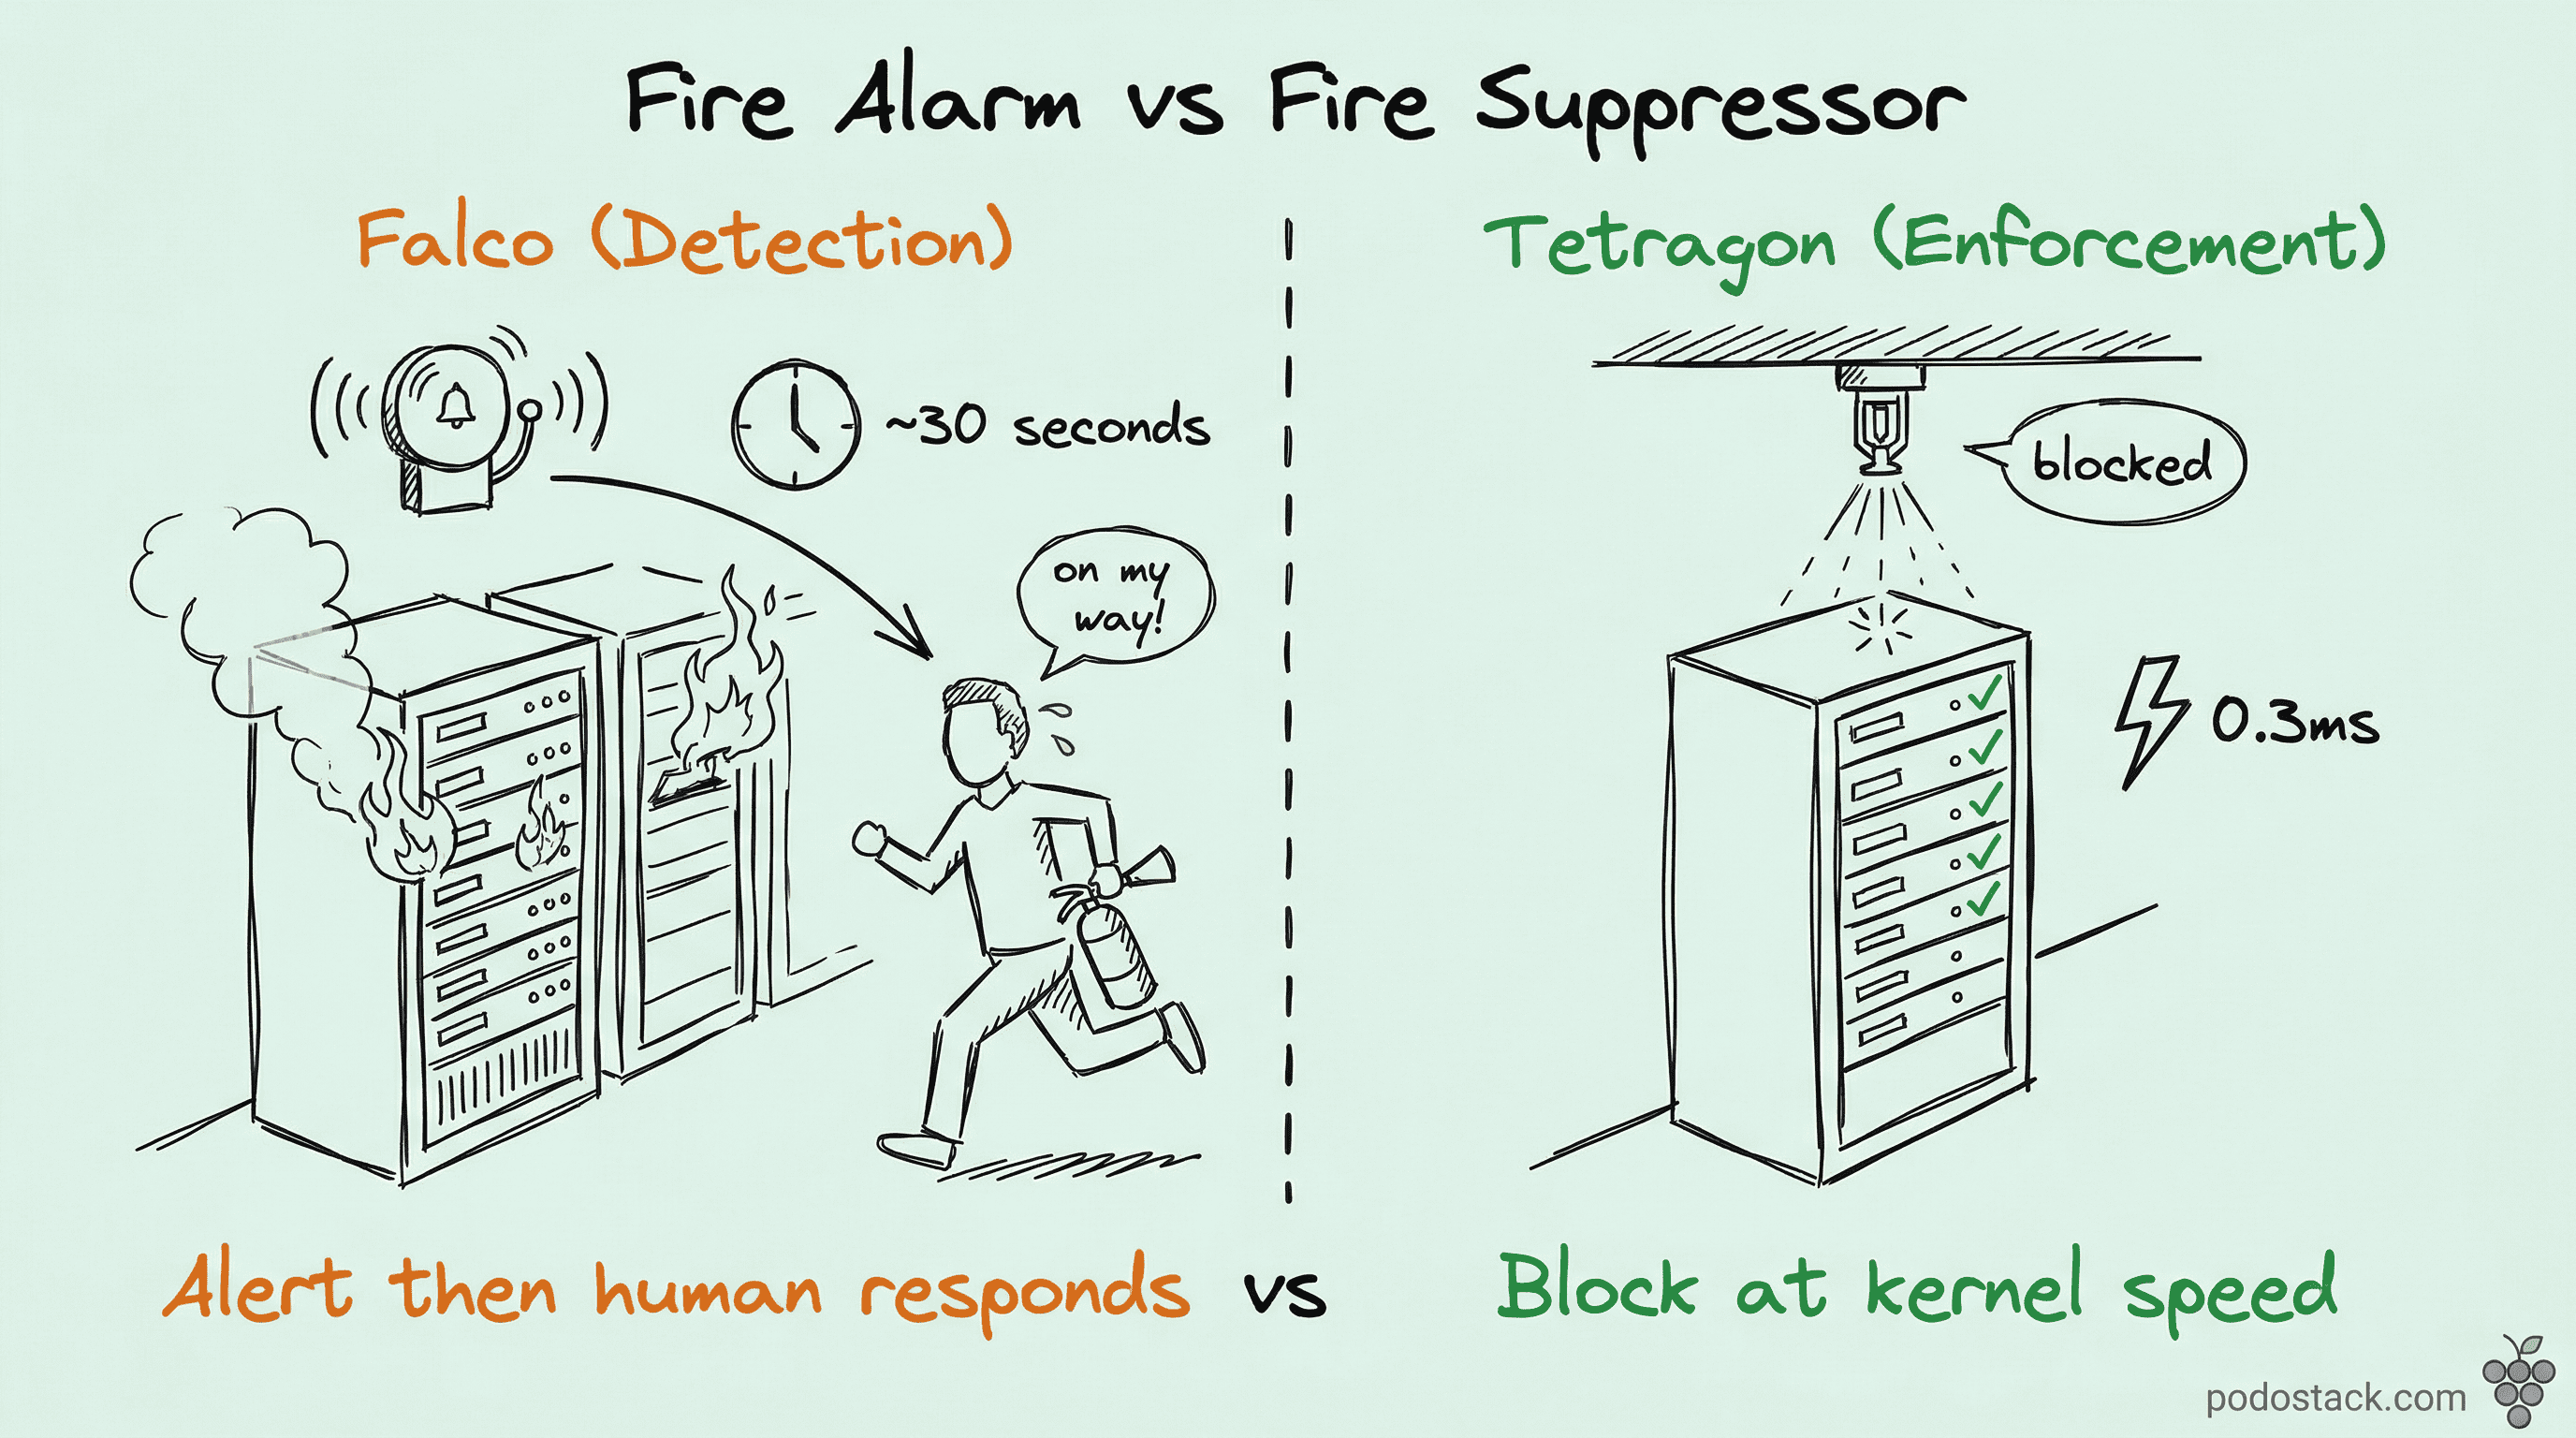
Falco is the CNCF Graduated standard for runtime threat detection. It intercepts syscalls via eBPF (or a kernel module), enriches events with Kubernetes metadata, and evaluates them against YAML rules. When something looks bad - shell in a container, unexpected network connection, read on /etc/shadow - Falco raises an alert. It’s a fire alarm.
Tetragon is a fire suppressor. Same data source (eBPF, syscalls), but instead of alerting, it kills the process in the kernel before the call finishes. No alert fatigue because the threat never completes.
Falco:
- Philosophy: Detect and alert
- Engine: Userspace rule evaluation
- Response: Alerts (Slack, PagerDuty, SIEM)
- Auto-remediation: Via Falco Talon (separate tool)
- Maturity: CNCF Graduated, 50+ output integrations
Tetragon:
- Philosophy: Enforce and prevent
- Engine: In-kernel eBPF programs
- Response: SIGKILL in kernel
- Auto-remediation: Built-in, kernel-level
- Maturity: CNCF project, Cilium ecosystem
The verdict
They’re complementary. Falco gives you the audit trail and the 50+ integrations for compliance. Tetragon gives you the kill switch. Run Falco for detection and forensics. Add Tetragon for the critical paths where “alert and hope someone notices” isn’t enough.
🔬 The Pattern: SLO from YAML with Sloth
The problem
Everyone agrees on SLOs. Nobody measures them. Why? Because writing Prometheus recording rules for SLO tracking is painful. You need multi-window burn rate calculations, error budget tracking, and alerting rules that predict budget exhaustion. That’s 50+ lines of PromQL per SLO. Per service.
The fix
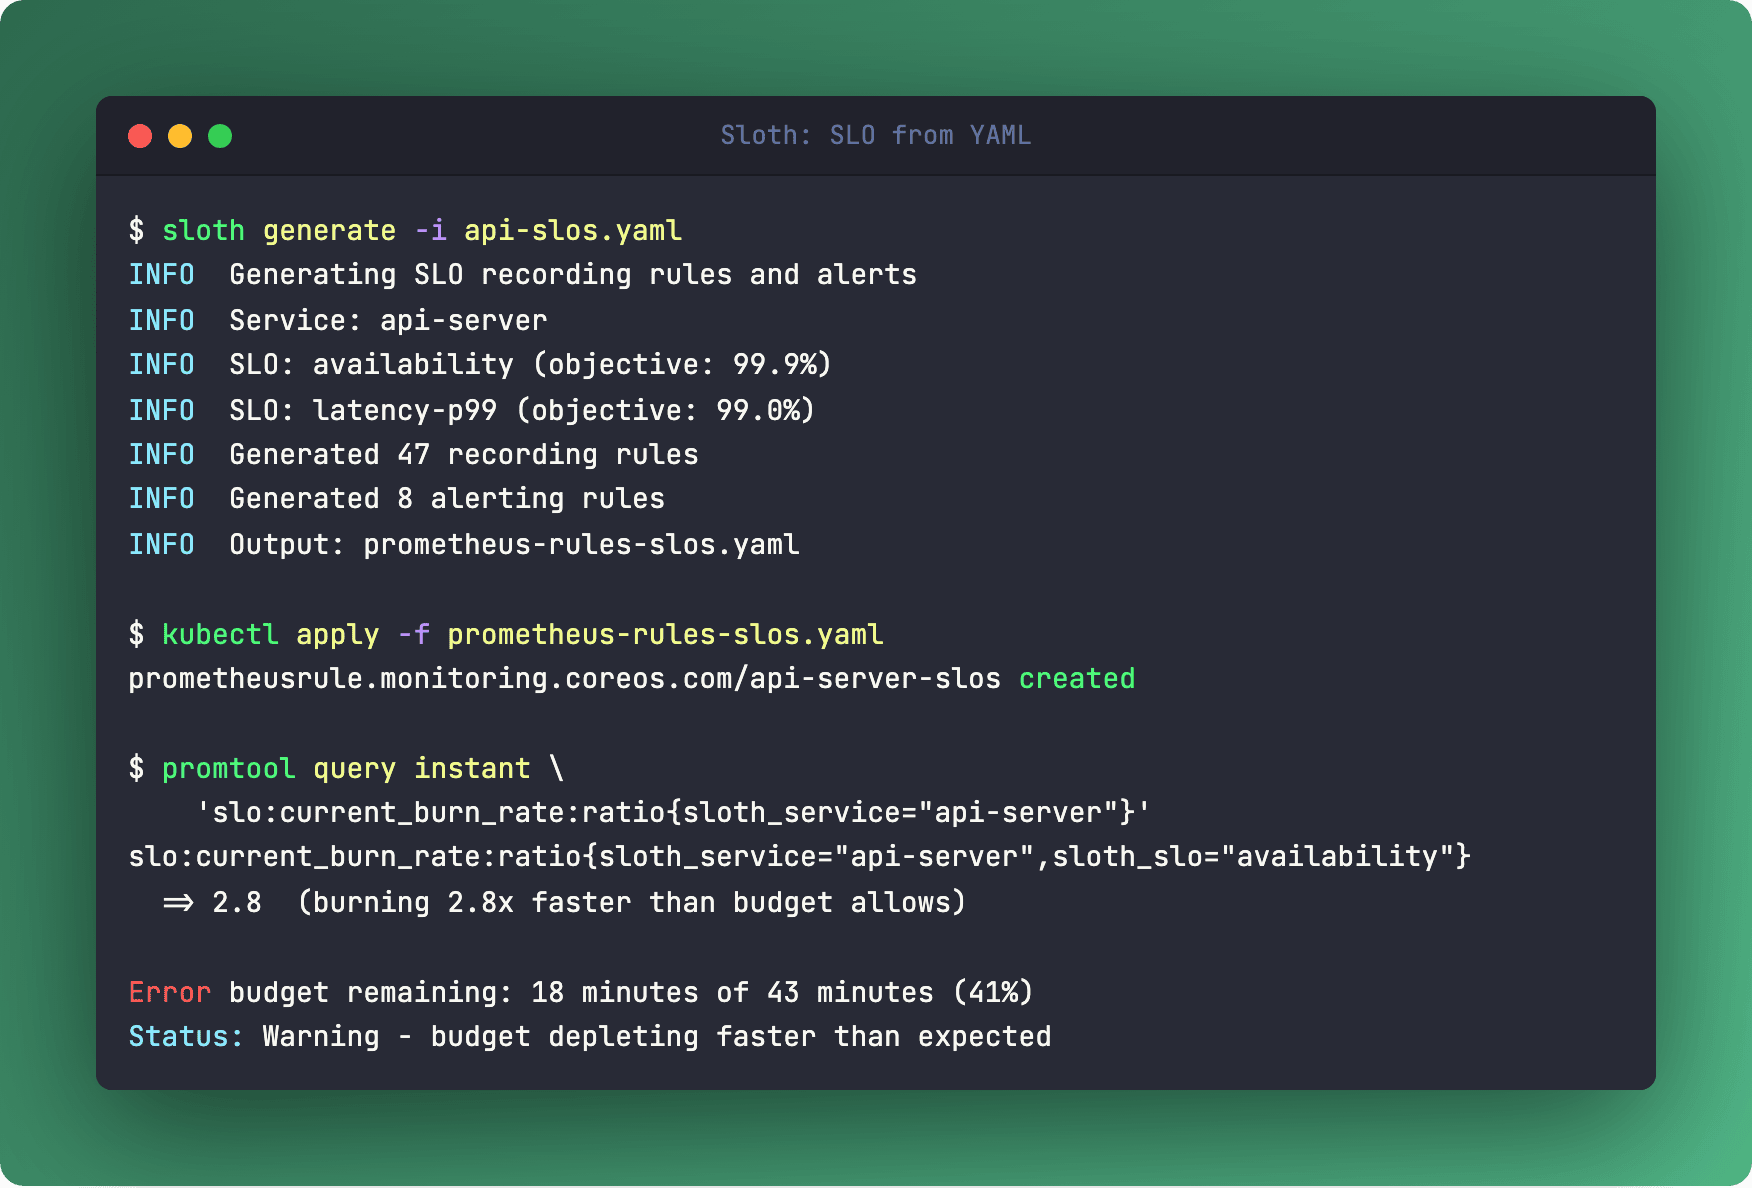
Sloth takes a YAML file and generates all of it.
version: "prometheus/v1"
service: "my-api"
slos:
  - name: "availability"
    objective: 99.9
    sli:
      events:
        error_query: sum(rate(http_requests_total{status=~"5.."}[{{.window}}]))
        total_query: sum(rate(http_requests_total[{{.window}}]))
Run sloth generate, apply the output, and you get:
Recording rules for burn rates across multiple time windows (5min, 30min, 1h, 2d, 6h)
Multi-burn-rate alerts that fire before your budget runs out
Grafana dashboards showing remaining error budget
99.9% availability sounds impressive until Sloth shows you that’s 43 minutes of allowed downtime per month. And your budget is burning 3x faster than expected after last Friday’s deploy.
Links
🛠️ The One-Liner: Grafana Alloy
kubectl get pods -n monitoring -l app.kubernetes.io/name=alloy \
  -o custom-columns='NAME:.metadata.name,READY:.status.conditions[?(@.type=="Ready")].status'
If you’re still running Prometheus + Promtail + OTel Collector as three separate things, Grafana Alloy replaces all of them. One agent. Metrics, logs, traces, profiles.
Alloy is a Grafana distribution of the OpenTelemetry Collector with a programmable config language (think HCL, not YAML). It natively scrapes Prometheus targets, collects logs, receives OTLP traces, and - the standout feature - supports built-in clustering. Multiple Alloy instances automatically distribute scrape targets across the cluster.
It’s vendor-neutral despite the Grafana branding. Send data to Prometheus, Loki, Tempo, Mimir, or anything OTLP-compatible.
Links
🔥 The Hot Take: The Three Pillars Are Now Four
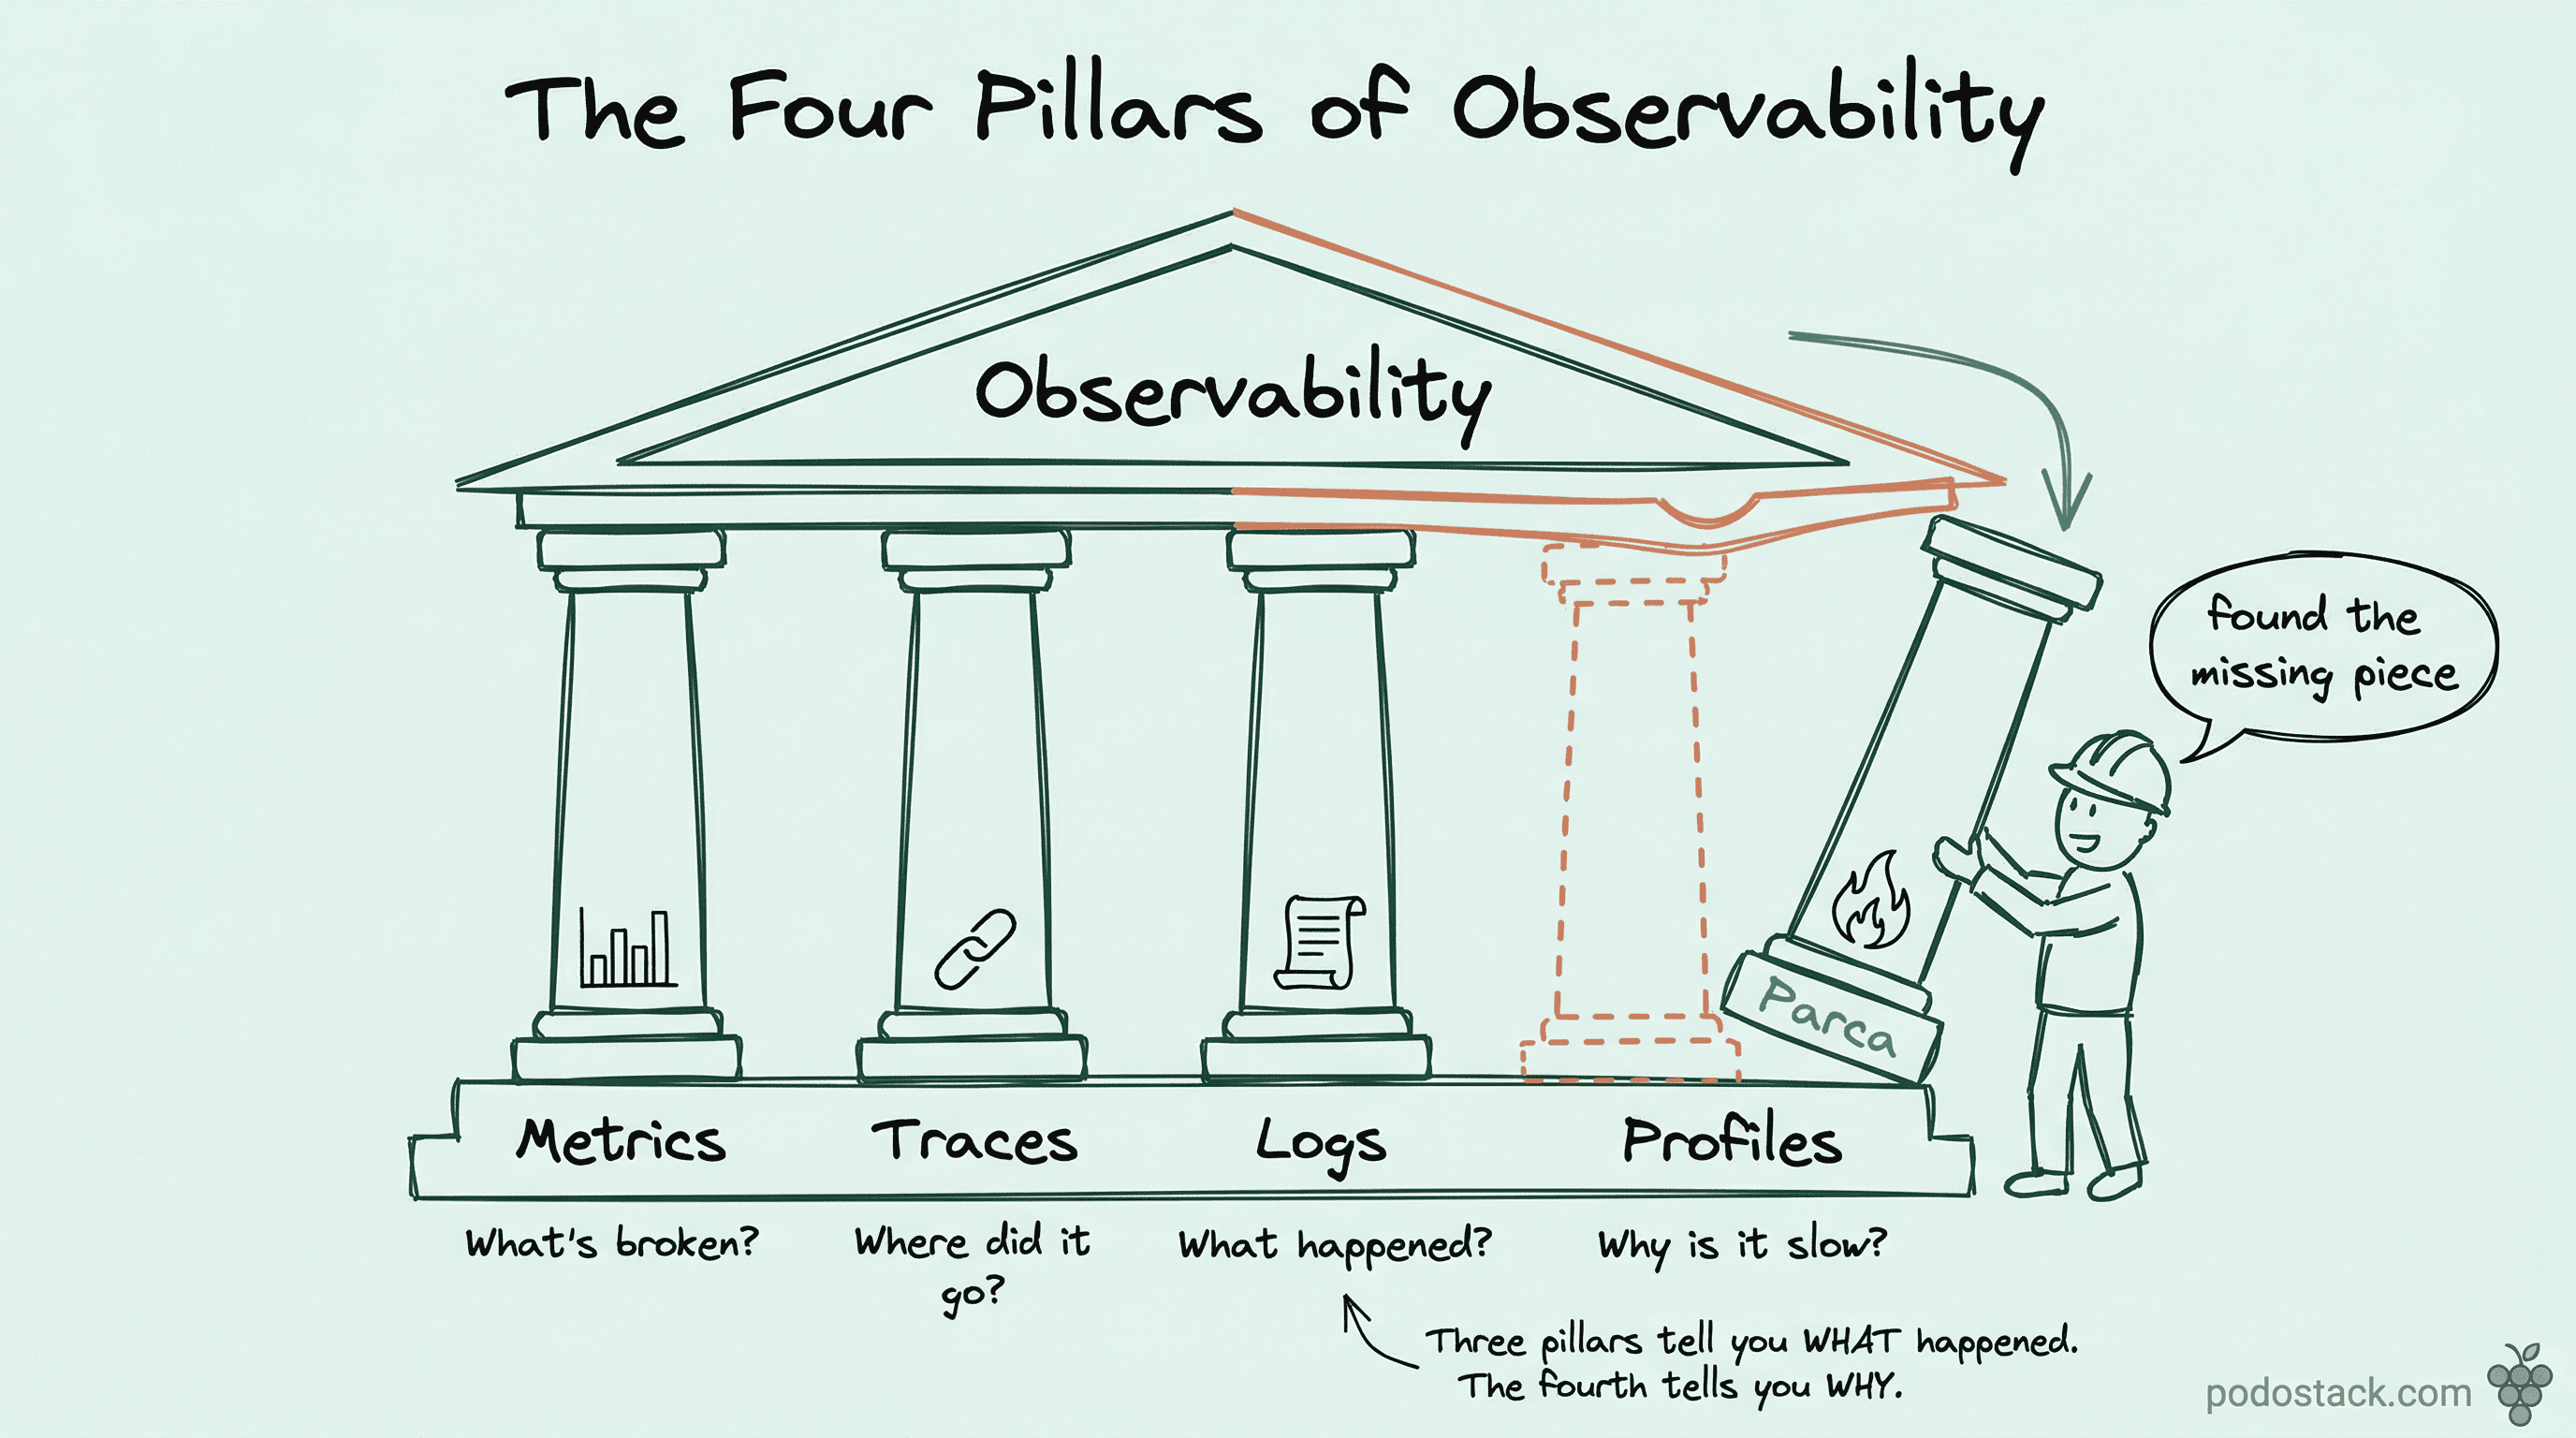
We spent years building the “three pillars of observability” - metrics, logs, traces. And then we realized we still can’t answer “why is this function slow?”
Continuous profiling is the fourth pillar. Parca, Pyroscope, and even Grafana Cloud are betting on it. The difference: profiles show you where in the code the problem is. Not which service, not which endpoint - which function, which line.
Combine Prometheus (what’s broken), Grafana Tempo (where the request went), Loki (what happened around it), and Parca (why it’s slow at the code level). That’s full observability.
Agree? Reply and tell me if you’re already profiling in production.
Questions? Feedback? Reply to this email. I read every one.
🍇 Podo Stack - Ripe for Prod.