

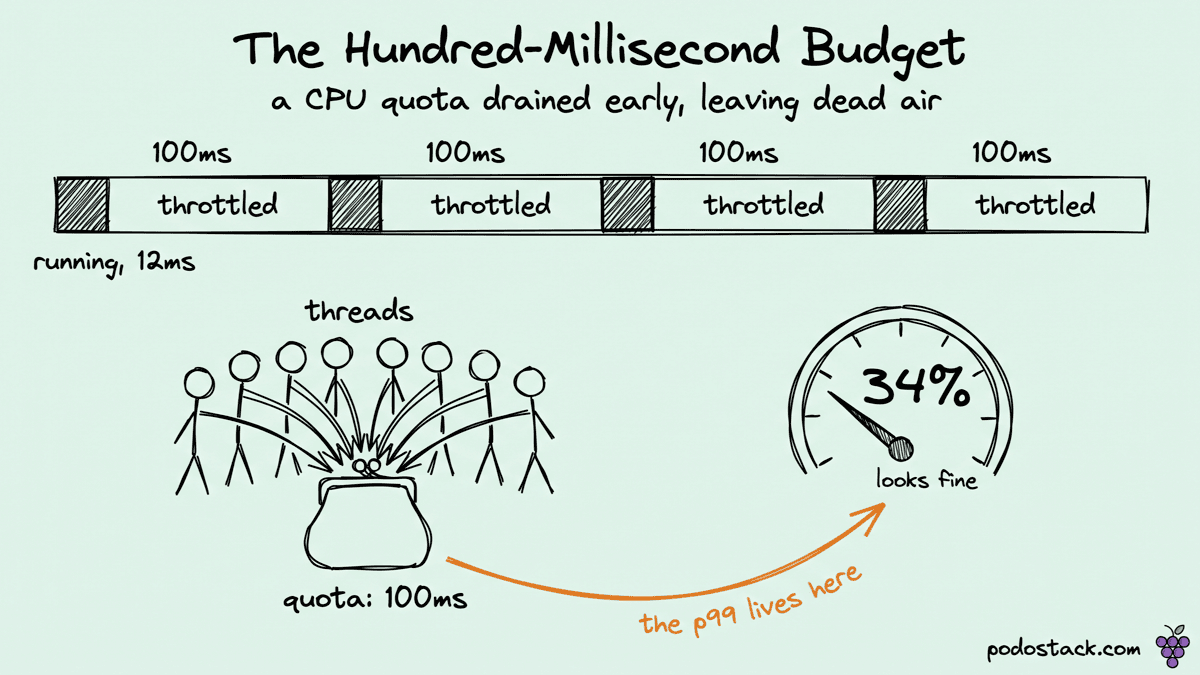
The service was using 340 millicores. Its limit was 1000. The dashboard showed 34% CPU utilisation, comfortably green, and it was being throttled 31% of periods. Somebody had already opened a ticket asking why we were paying for CPU we weren't using, and somebody else had opened one asking why p99 had tripled, and for two weeks nobody connected them.
They are the same ticket. The number on the dashboard is an average over a minute or a scrape interval. The kernel isn't averaging over a minute. It's making a decision every hundred milliseconds, and at that resolution the workload looks nothing like 34%.
Back in issue #015 I went through what requests does on the way to the kernel - the conversion into cpu.weight, and the priority that got silently rescaled in the cgroup v1 to v2 migration. This is the other half of the pair, and it behaves nothing like it. requests is a relative claim that only matters when the node is contended. limits is an absolute budget that's enforced whether or not anybody else wants the CPU.
🏗️ Architectural Pattern: a limit is a budget, not a speed cap
What the number becomes
limits.cpu: 1 doesn't tell the scheduler to run your container at most one CPU fast. There's no such mechanism. What it does is set two files.
On cgroup v2, one file:
# cpu.max
100000 100000
Quota, then period, in microseconds. Your container may consume 100,000 microseconds of CPU time per 100,000 microsecond window. On cgroup v1 the same values live in cpu.cfs_quota_us and cpu.cfs_period_us. The period defaults to 100ms and Kubernetes doesn't expose a way to change it per pod.
The enforcement is brutally simple. The kernel tracks how much CPU time the cgroup has consumed in the current period. When the budget hits zero, every thread in that cgroup is dequeued and stays off-CPU until the period rolls over. Not slowed. Stopped.
That distinction is the whole issue. If a limit were a speed cap, a container using 34% of it would never notice. Because it's a budget with a hard refill boundary, a container can spend its entire budget in the first fifteen milliseconds of a period and then sit dead for eighty-five, and the minute-average will still say 34%.
Threads spend the budget in parallel
Service applications get hit by this far harder than batch ones, and the reason is arithmetic.
Quota is CPU-time, summed across all threads. A single-threaded process with limits.cpu: 1 consumes 100ms of quota over 100ms of wall clock, and never throttles, because the two rates match exactly. Give the same limit to a process with eight runnable threads on an eight-core node, and it consumes 100ms of quota in 12.5ms of wall clock. It then has 87.5ms of enforced silence before the next refill.
Nothing about that's misconfiguration. That's a JVM with a thread pool sized to the machine, a Go binary with GOMAXPROCS picked up from the node's core count, a Node process with its libuv pool, nginx with worker_processes auto. Runtimes size themselves to the hardware they can see, and what they see is the node, not the cgroup.
The measured utilisation stays low the whole time, because the container really is idle for most of every period. It just happens to be idle in the specific way that adds up to 87 milliseconds of tail latency on any request unlucky enough to arrive at the wrong moment.
The metric that shows this isn't CPU usage. It's:
rate(container_cpu_cfs_throttled_periods_total[5m])
  / rate(container_cpu_cfs_periods_total[5m])
Anything meaningfully above zero on a latency-sensitive service is a finding. I've never seen a team that watches this and also has a mysterious p99 problem.
Links
🆚 The Showdown: the 2019 kernel fix vs the bug people still have
There are two separate throttling problems and they get conflated constantly, which matters because one of them is fixed and the other one is physics.
The one that got fixed
In 2019 Dave Chiluk at Indeed chased down containers that were being throttled heavily while using a fraction of their quota - not the parallel-spend effect above, but genuine phantom throttling where the accounting itself was wrong.
The cause was slice expiration. The global quota pool handed out CPU time to per-CPU run queues in slices, and any slice a run queue didn't fully use expired at the end of the period instead of returning to the pool. A threaded application that briefly touched many cores would scatter small unusable remnants across all of them, and the global pool would run dry while most of the quota sat stranded. His fix removed the expiration of cpu-local slices, and his test case on an 80-CPU machine with a 10ms/100ms allocation improved by roughly 30x.
It landed in Linux 5.4, in late 2019. If you're on anything modern, you have it, and any blog post about CPU throttling that predates 5.4 is describing a different kernel than the one you're running.
The one that is still there
What 5.4 didn't change - what nothing can change, short of removing the quota - is the parallel-spend arithmetic. Eight threads still burn the budget eight times faster than wall clock. That isn't a bug, it's what a CPU-time budget means.
Linux 5.14 added a genuine mitigation: cpu.cfs_burst_us, which lets a cgroup bank unused quota from quiet periods and spend it during a spike, up to a configured ceiling. It directly targets the bursty-service case, and it works.
Kubernetes can't set it. The request to expose it is issue #104516, it has been open since 2021, and as of v1.36 there's still no pod-spec field for it. The teams that use burst today do it out of band - Koordinator and Alibaba's ACK both reach past the pod spec and adjust cgroup parameters on the node directly, which works and also means the value in your manifest no longer describes what's enforced.
So the honest state of things in 2026: the kernel has a good answer, the orchestrator doesn't expose it, and your remaining lever is whether the quota exists at all.
Links
👮 The Policy: the two conditions for deleting a limit
Remove limits.cpu, keep requests.cpu, and the container gets a weight instead of a budget. Under contention it gets its proportional share. When the node is quiet it uses whatever is spare. No cpu.max, no periods, no throttling, and the tail latency that came from the quota boundary goes away.
This isn't a fringe position. It's what the kernel's own scheduling model wants you to do, and it's the default advice from most people who have debugged this at depth. It's also not unconditionally safe, and the two conditions are specific.
Condition one: requests are actually set, everywhere, and they're honest. Without a limit, requests is the only thing standing between your workload and a neighbour's. If half the pods on the node have no requests either, you haven't removed a budget, you've removed the last piece of resource management and you'll find out during the next traffic spike. Enforce it with a policy rather than a convention - a Kyverno rule requiring requests.cpu on every container is about six lines, and it's the actual prerequisite for everything else here.
Condition two: you aren't relying on Guaranteed QoS. A pod is Guaranteed only when every container has limits equal to requests for both CPU and memory. Drop the CPU limit and the pod becomes Burstable. Most of the time nobody cares. It matters if you use the static CPU Manager policy - exclusive core pinning requires Guaranteed and integer CPUs, so removing the limit silently turns pinning off for that pod. It also shifts the pod's position in node-pressure eviction ranking. If neither applies to you, and for most web services neither does, the reclassification is cosmetic.
The honest part
Two cases where I keep the limit.
Untrusted or third-party workloads, where the point isn't efficiency but blast radius. A vendor sidecar that spins on a bug should hit a wall, and a weight won't give you one.
Chargeback environments where the limit is the billing contract. The throttling is the product working as sold, and arguing about tail latency with the platform team isn't going to change the invoice.
And one thing I wouldn't do: keep the limit but raise it "to be safe". It's a real improvement - a bigger budget throttles less - but it's also the option that leaves you the least informed, because the throttling never goes to zero and you never learn what the workload actually needs. Either the budget is doing a job you can name, or it shouldn't be there.
The rollout that works is boring. Pick the service with the worst throttle ratio, remove the limit on that one, watch p99 and node CPU for a week. The first one is an experiment. After the third, it's a policy.
Links
What the dashboard was never going to tell you
The reason this survives in so many clusters is that every instrument points the wrong way. Utilisation looks fine. Requests and limits look responsibly configured, because somebody set them deliberately. The limit was probably added by a thoughtful engineer during a capacity review, and it did what they asked. The cost landed somewhere they weren't looking.
The one number that would have caught it in an afternoon is the throttle ratio, and almost nobody graphs it, because it isn't in the default dashboard of anything.
We put it on the platform overview next to CPU and memory. Two services lit up immediately, both of them ones nobody had complained about, both of them well under half their limit. The ticket that got filed was for the loudest case, and it wasn't the worst one.
Questions? Feedback? Reply to this email. I actually read them.
Ilia