
Podo #015: The Quietest Performance Bug: What Happens in a Pod's First 60 Seconds
cgroup v2 weight inheritance, image preload operators, Stargz/Spegel refresh, noisy neighbor interference, and the pentester's view of fresh pods

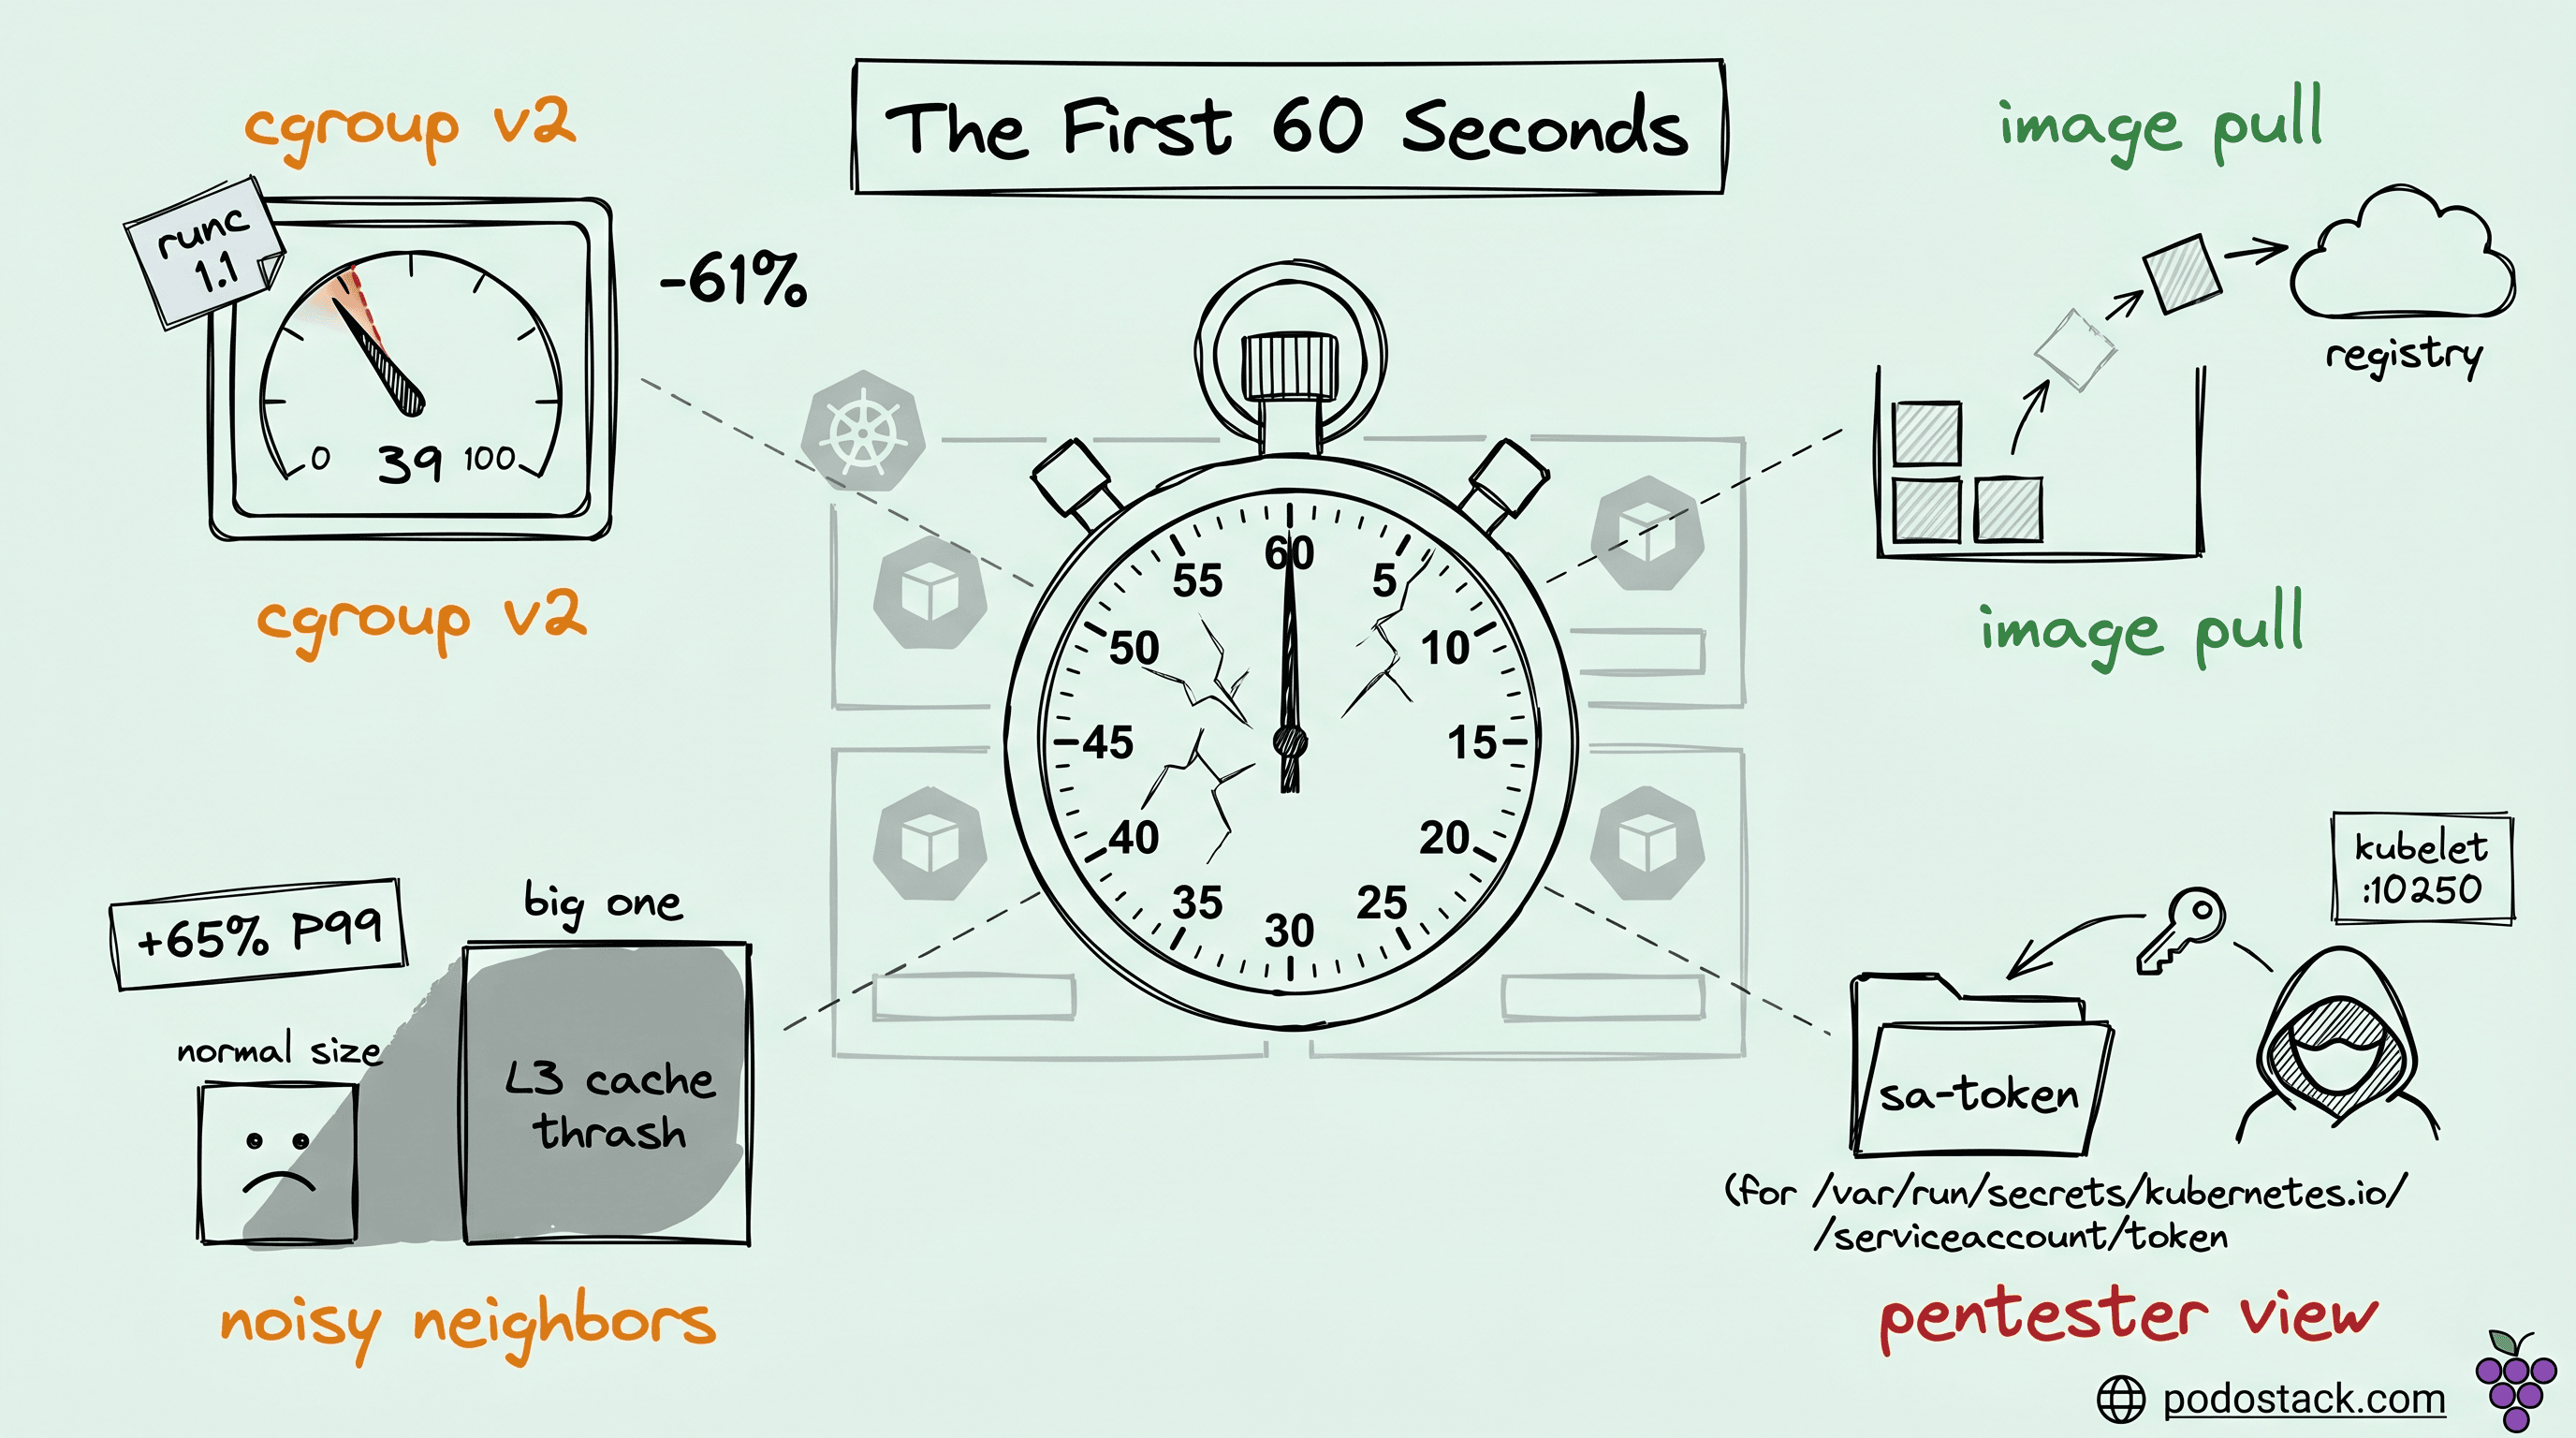
Welcome back to Podo Stack. Every SRE I know has a graph they can't explain - pods that looked fine at deploy time but started eating P99 latency when the cluster filled up. Most of the time it isn't a memory leak, not GC, not a bad query. It's the first 60 seconds of a pod's life, where four separate things go wrong quietly and no standard dashboard shows any of them.
This week: cgroup v2 weight drift that ate 61% of your CPU priority without telling you, four different ways to beat image pull delay, why the scheduler can't see the noisiest neighbors, and what a pentester sees when a pod lands in your cluster.
Here's what's good this week.
cgroup v2 silently ate 61% of your CPU priority
The linear formula was the wrong shape.
If you migrated to cgroup v2 recently (modern K8s distros require it now), you probably ran smoke tests, saw pods running, called it done. What you actually shipped, depending on your OCI runtime version, is a cluster where cpu.weight values are silently wrong.
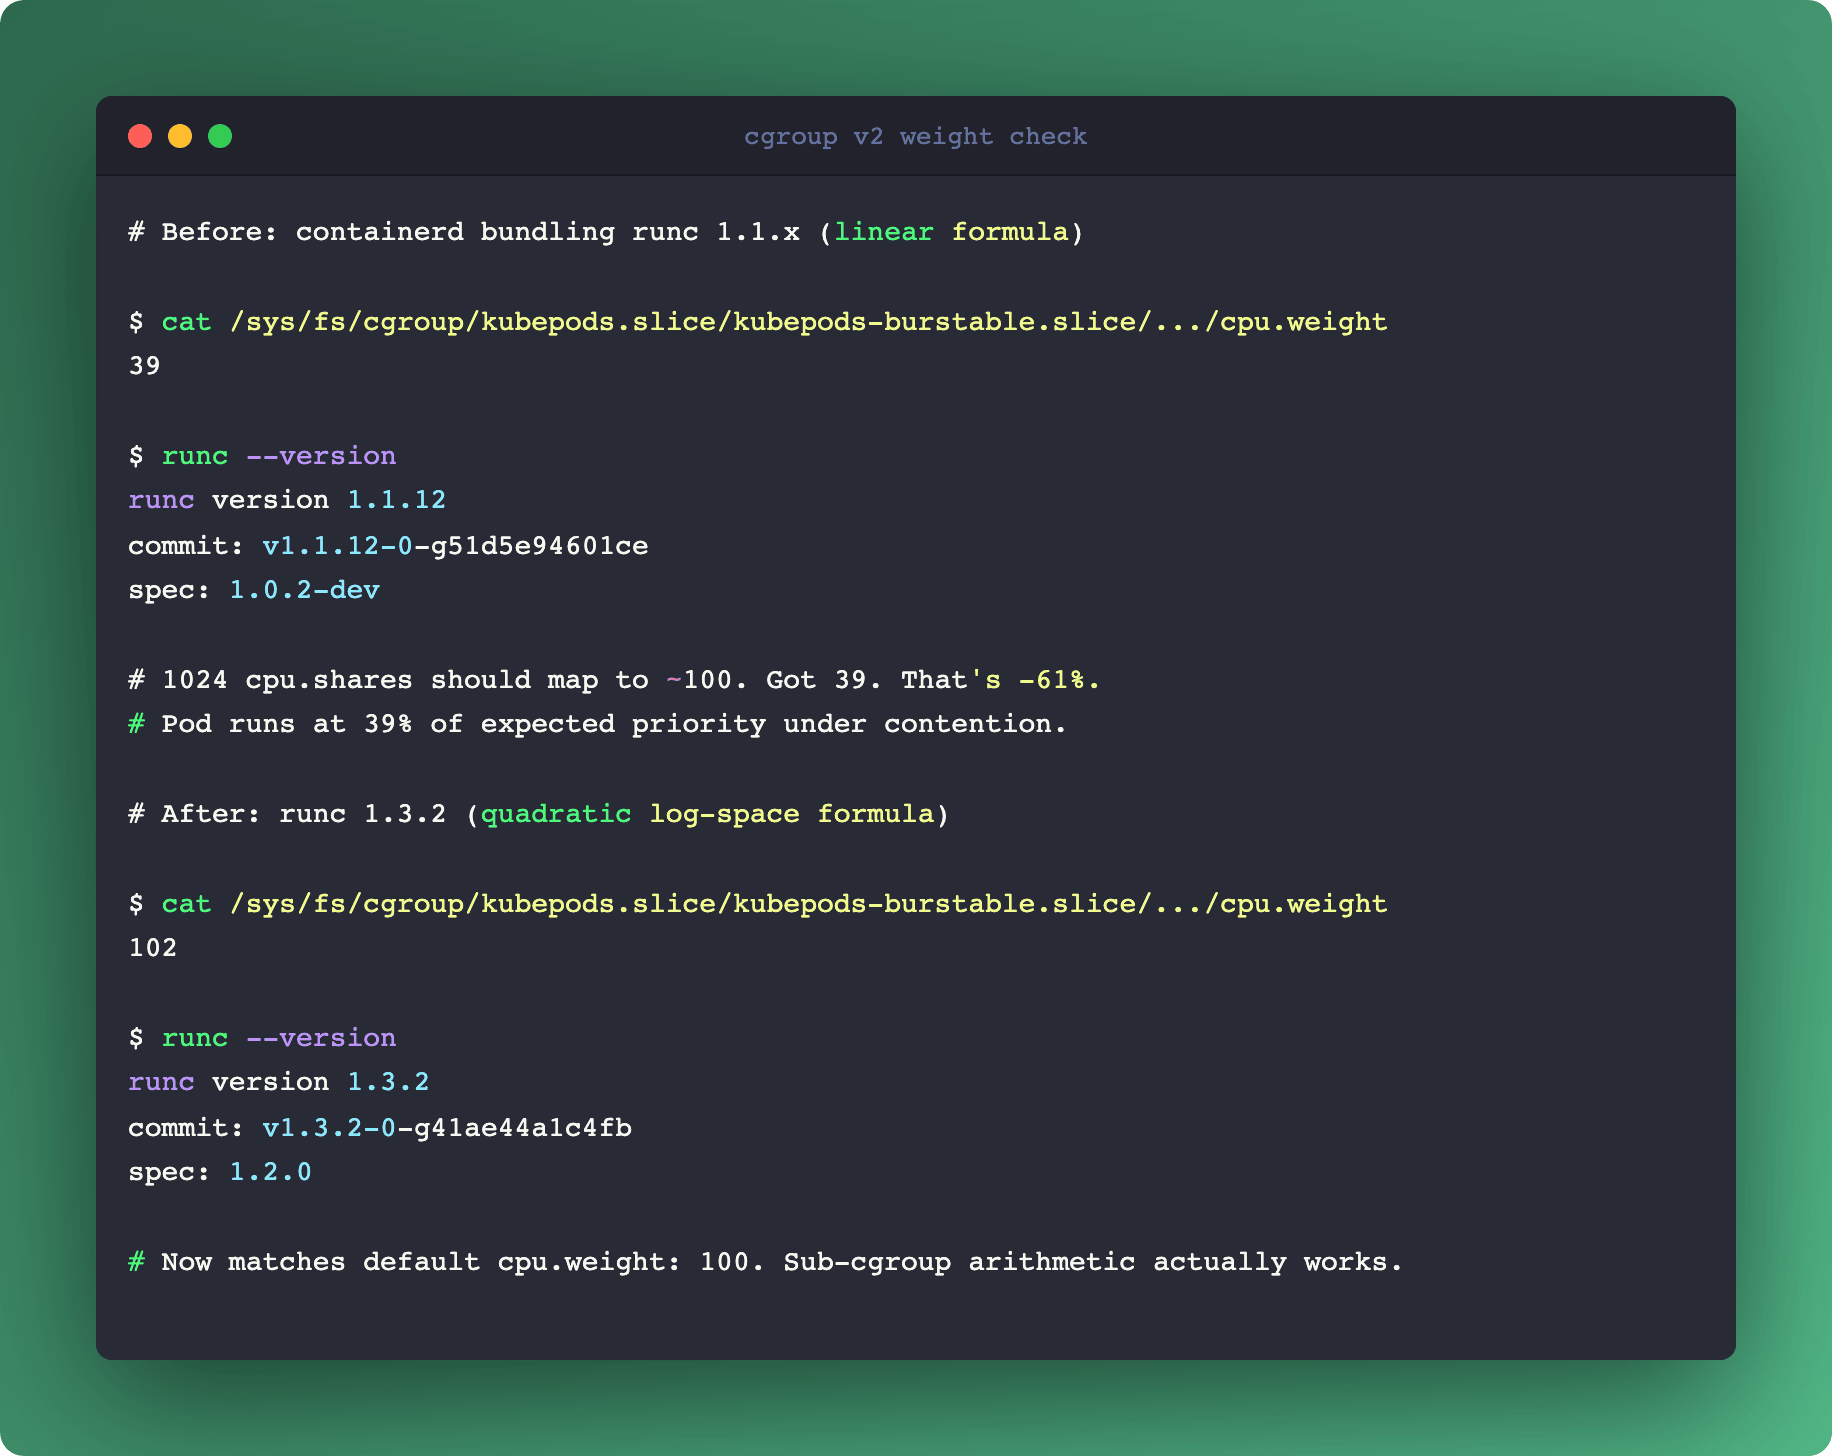
The short story: runc and crun used a linear formula to translate v1 cpu.shares into v2 cpu.weight. Math-wise, that's the wrong shape. v1 shares are on a log scale, v2 weight is bounded on [1, 10000] with default 100. A Pod with 1024 shares (one full CPU) ended up with weight 39, not the expected default of 100. A pod with 100m CPU request got weight 4 - not enough granularity for sub-cgroups to mean anything.
Under contention, that pod behaves as if it has 39% of the priority it thinks it has. You don't see it in kubectl top. You don't see it in node-exporter. You see it in the P99 graphs nobody can explain.
The fix (kubernetes.io/blog/2026/01/30/new-cgroup-v1-to-v2-cpu-conversion-formula/, Itamar Holder at Red Hat) is a quadratic formula in log space:
cpu.weight = ⌈10^(L²/612 + 125L/612 - 7/34)⌉
where L = log₂(shares)
After the fix, 1024 shares map to weight 102 (near the default 100). 100m CPU maps to weight 17, which is actually usable for sub-cgroup arithmetic.
The critical catch: the fix lives in the OCI runtime, not in Kubernetes. runc 1.3.2+ or crun 1.23+. If your nodes run an older containerd that bundles older runc, you still ship the broken formula. GitHub issue kubernetes/kubernetes#131216 tracks the adoption lag.
How to actually check on a running node:
$ cat /sys/fs/cgroup/kubepods.slice/kubepods-burstable.slice/.../cpu.weight
39
$ runc --version
runc version 1.1.12
That's weight 39 instead of ~100. Time to upgrade the runtime.
This touches bin-packing too. Karpenter's consolidation (Podo #014) and the FinOps math from Podo #007 both assume cpu.weight reflects the workload's actual priority claim. When weights are wrong by a factor of 2-3x, cost decisions inherit that error. The silent-failure category is the worst kind - everything keeps running, just quieter and worse than it should, forever.
Links
Four ways to kill image pull delay
One problem, four philosophies, and they compose.
Cold image pull is the dominant source of pod startup latency once you've fixed the cgroup problem. You have four options in production, and most teams only know one.
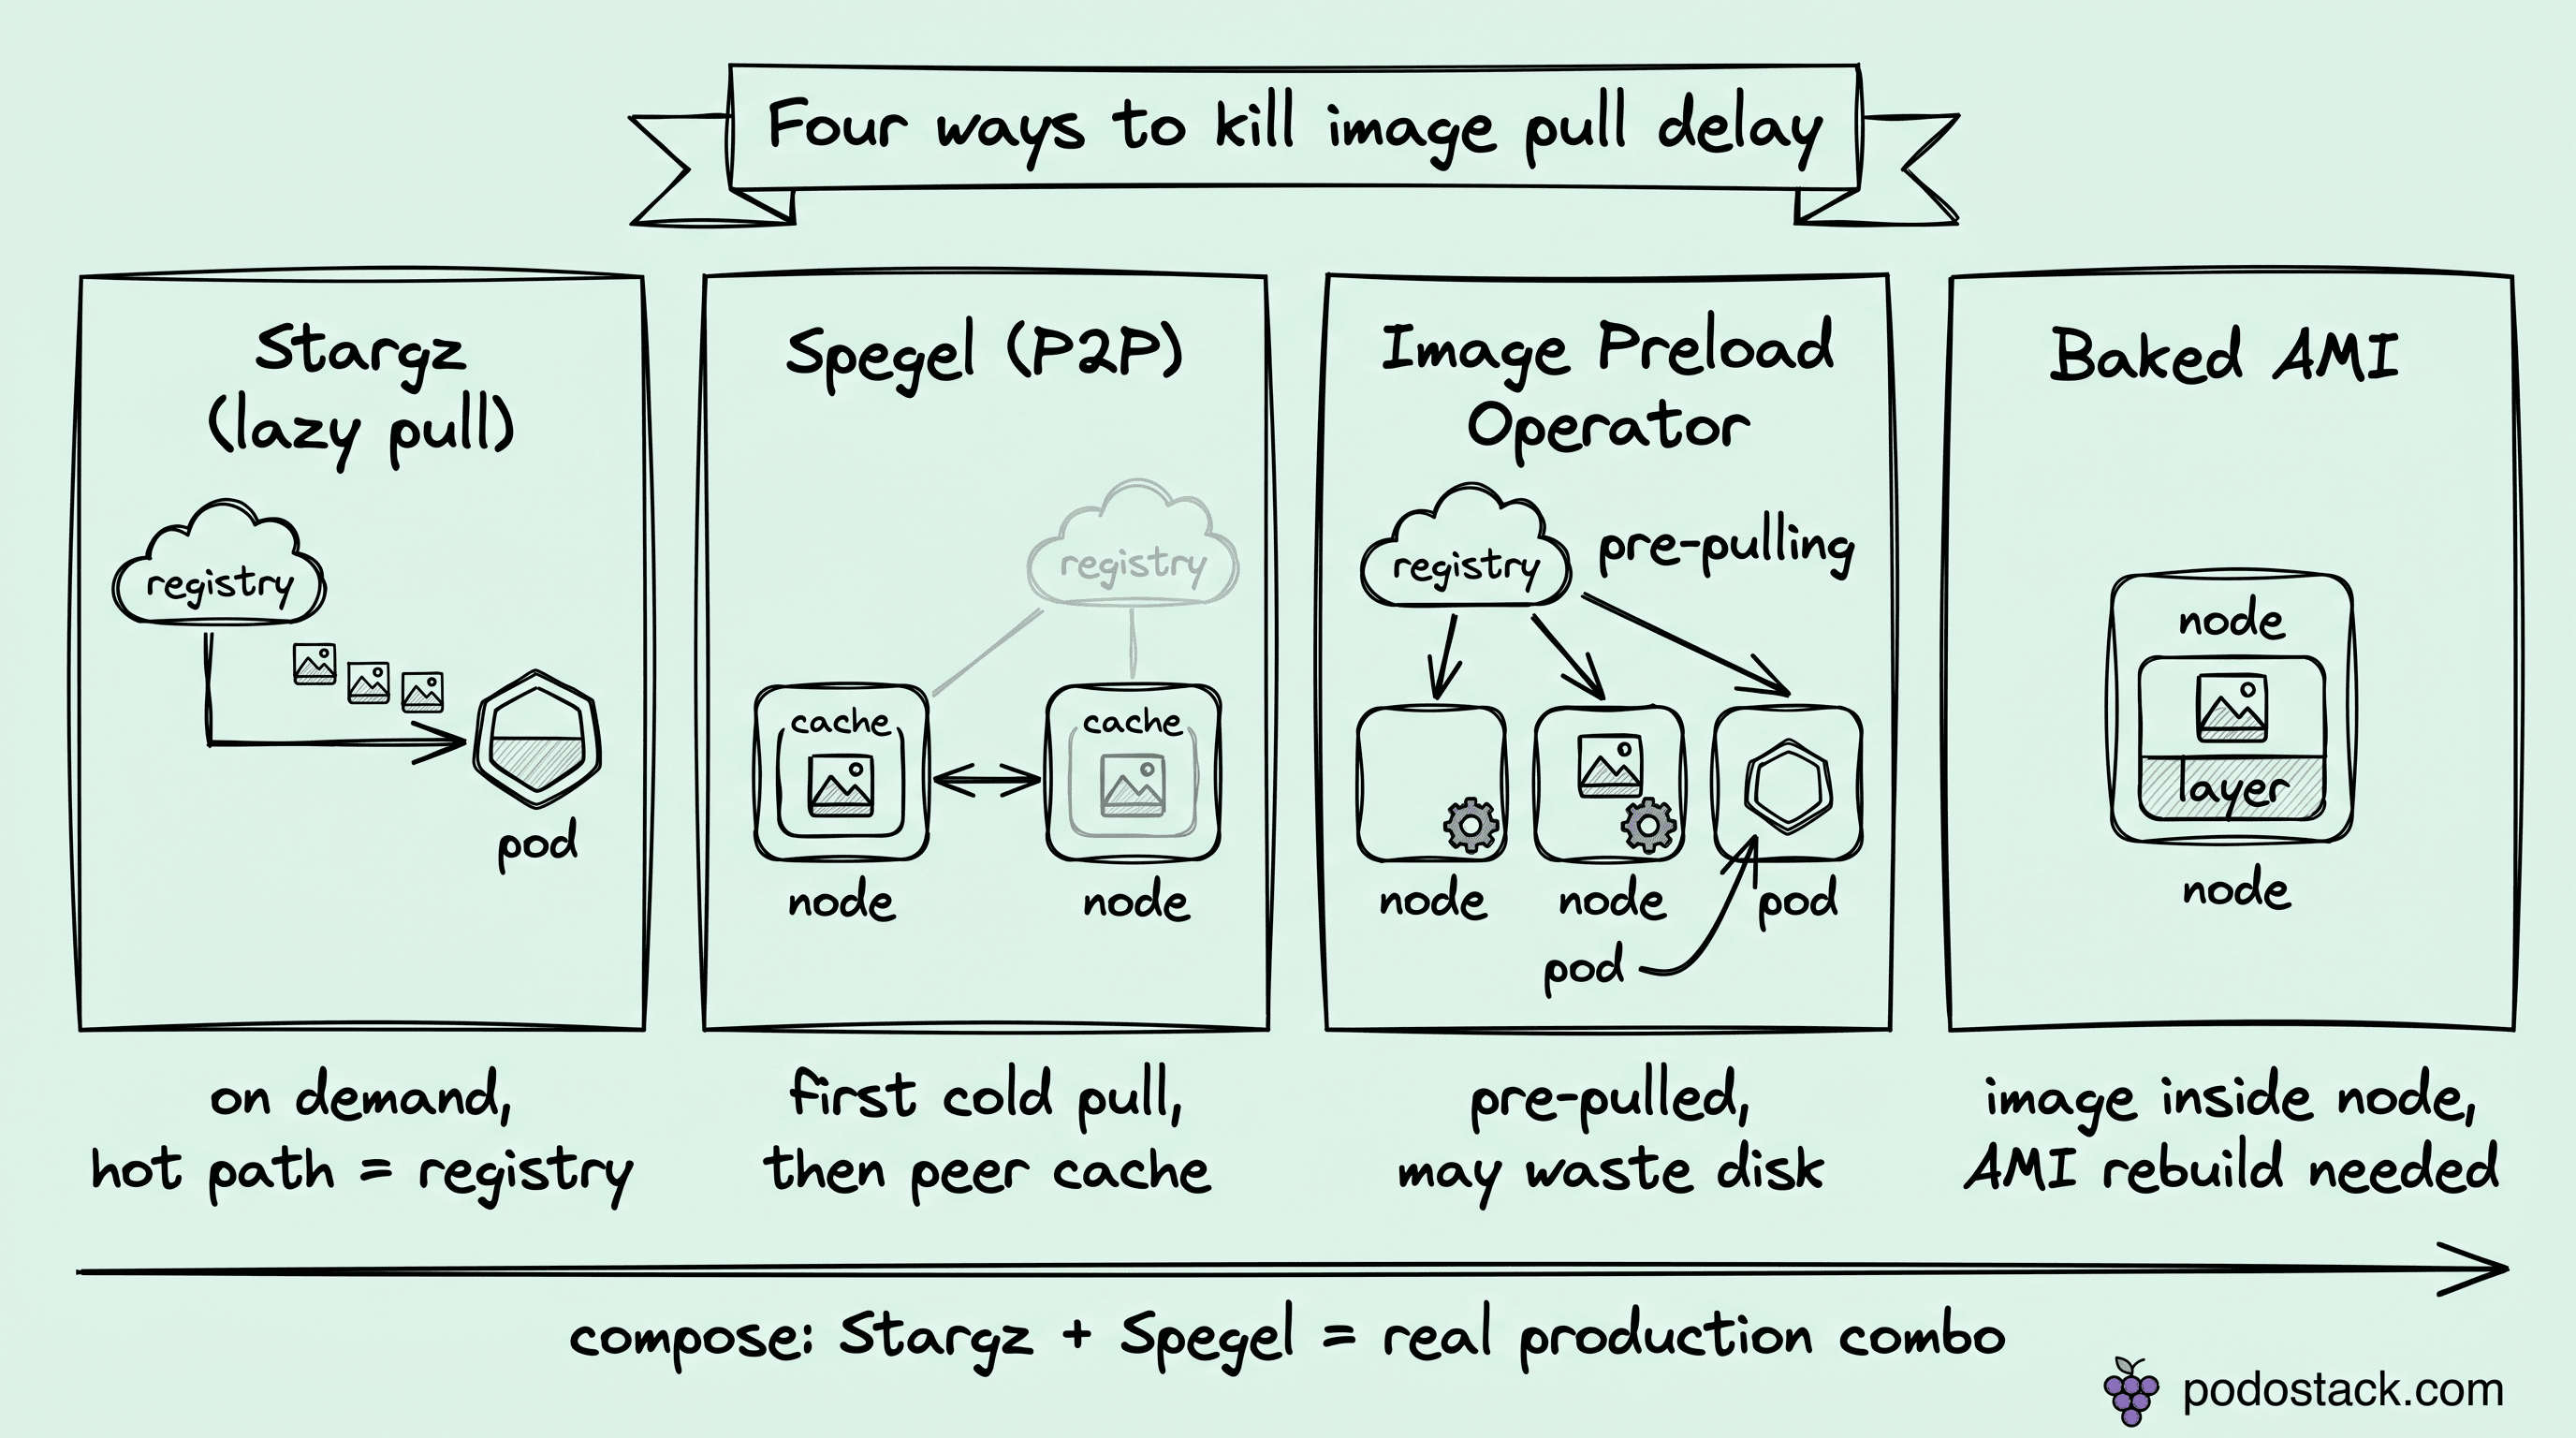
Stargz (Podo #001) is lazy pull. The image is read on demand, so a 2 GB container can start serving traffic within seconds instead of waiting for the full pull. Pros: zero pre-work, cold nodes fast on first touch. Cons: first access to any uncached chunk still hits the registry, and you've added a dependency in the hot path.
Spegel turns nodes into peers. Each node serves image layers it already has to other nodes in the cluster over P2P. Pros: kills registry pressure on burst scale, keeps bandwidth inside the cluster. Cons: every node has to participate, and someone still cold-starts the first copy somewhere.
Image Preload Operator runs as a DaemonSet that pulls a declared set of images ahead of time. Pros: deterministic readiness, CRI-agnostic (containerd, CRI-O, Docker). Cons: fetches images that pods may never schedule, so disk goes to waste on node pools with high tenant variance.
Baked AMI (or golden images) bakes the container image into the node image itself. Pros: literally zero pull at boot, simplest ops surface. Cons: every image update means an AMI rebuild, slow feedback loop, and cross-version fleets get painful.
When to pick what:
Burst capacity, unpredictable image set → Stargz
Steady workload, small stable image set → Baked AMI
Multi-tenant cluster with shared base images → Spegel
Scheduled known workload per node pool → Preload Operator
These aren't mutually exclusive. Stargz + Spegel is a real production combination: Stargz handles cold reads, Spegel shaves registry egress when multiple nodes pull the same layer in the same burst.
What's wrong with picking just one: cold-start tail latency is multimodal. Single-philosophy solutions optimize the median and leave the tail. Layered solutions cost more to run but cap the worst case, which is the case you're actually paying for when a node group scales from zero.
Links
The scheduler can't see the neighbor stealing your latency
Cache contention lives in a blind spot.
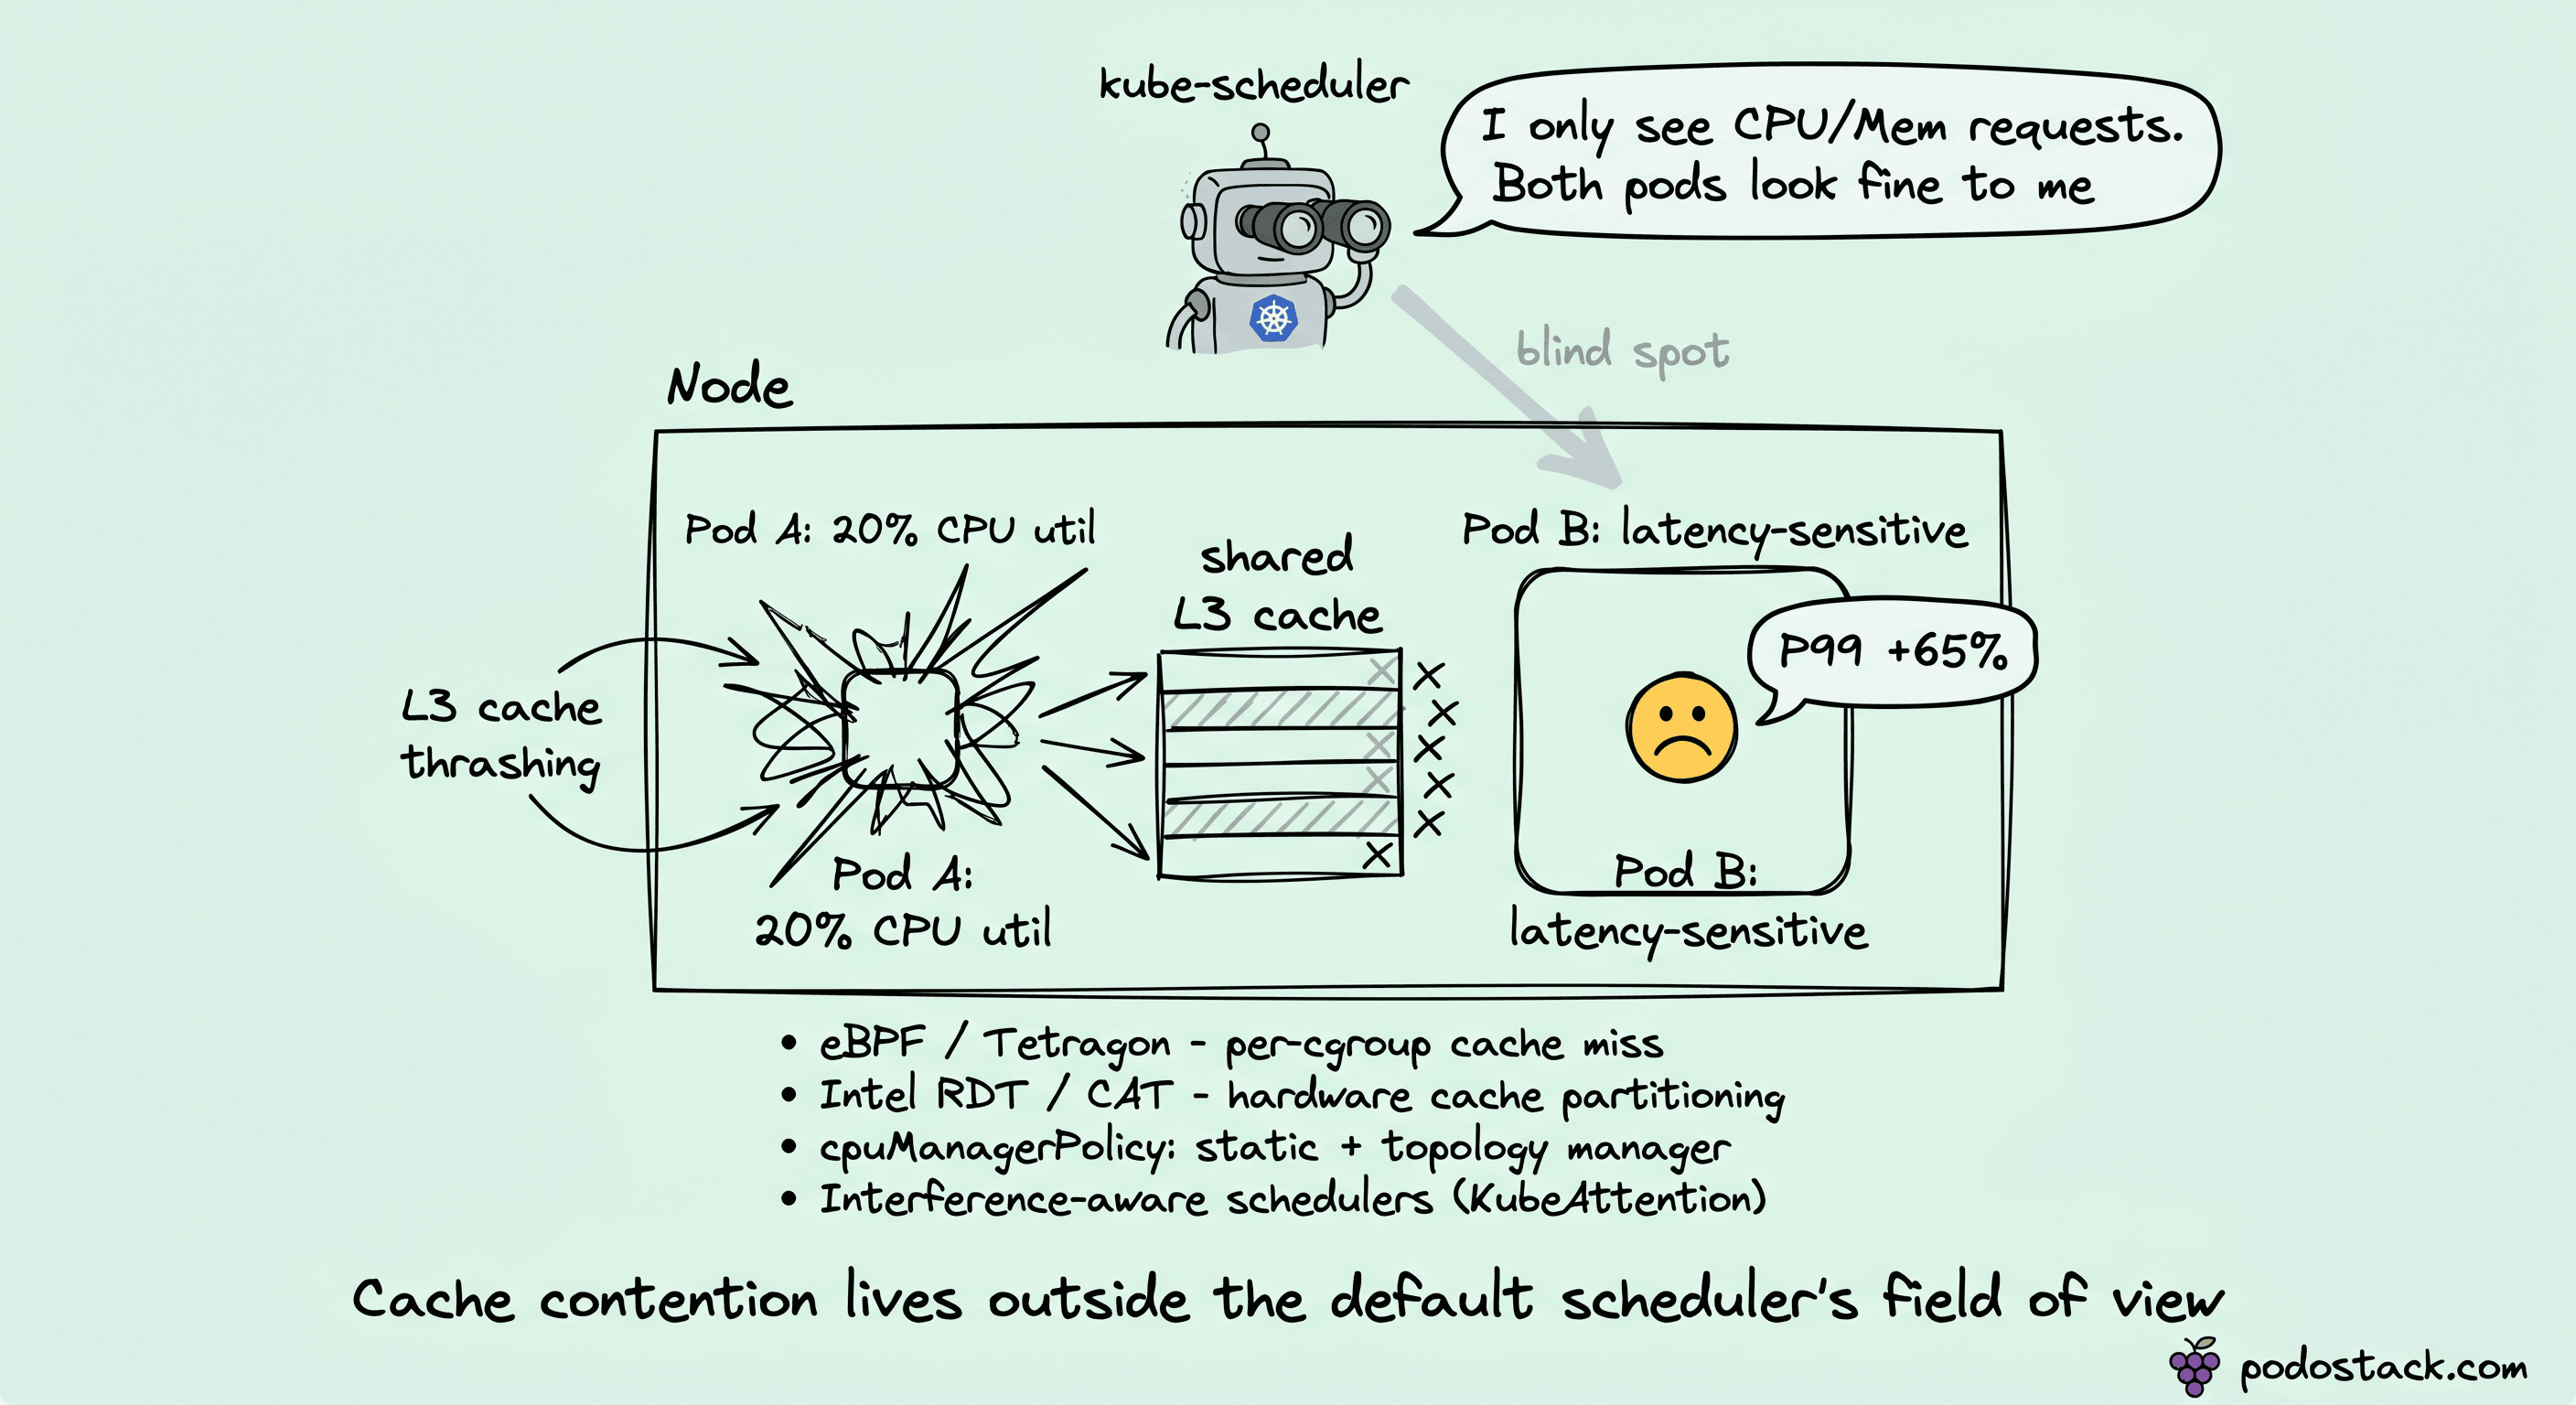
The default Kubernetes scheduler scores nodes on CPU requests, memory requests, and a handful of affinity rules. That model assumes workloads are CPU- or memory-bound in ways that show up in requests.
The failure case is micro-architectural contention. A Pod with 20% CPU utilization can thrash the L3 cache hard enough to add 65% to the P99 latency of a neighbor pod. Neither pod violates its limits. Both look healthy in kubectl top.
Metrics absent from requests and limits:
LLC (last-level cache) miss rate
Memory bandwidth saturation (DRAM pressure)
Disk I/O wait at the block layer
NUMA cross-socket traffic
How to collect any of this on a running cluster:
eBPF programs (Tetragon, Parca - Podo #011 covers the stack) hook cache-miss and IPC counters per cgroup.
Intel RDT (Resource Director Technology) surfaces hardware counters for cache occupancy and memory bandwidth per core.
PMU counters via
perfare classic but per-node, not per-workload, without extra wiring.
What you can actually do once you have data:
KubeAttention is one example of an ML scheduler plugin that scores nodes on 26 interference features. Not the answer, representative of the category.
Intel CAT (Cache Allocation Technology) partitions L3 cache between cgroup groups at the hardware level, works with cpuset isolation.
Descheduler is the reactive option: it moves pods off nodes where interference crossed a threshold. Fixes the symptom, not the placement.
cpuManagerPolicy: static plus topology manager pins CPUs per pod, avoiding NUMA crossing.
The frustrating part: teams hit this problem, spend weeks blaming the application code, and never notice the scheduler decision was the bug. No metric the default scheduler reads captures cache contention, so the root cause lives outside its field of view.
Interference-aware scheduling sounds exotic until you hit the wall. After that it looks obvious.
Links
A pentester's view of your brand-new pod
The same 60 seconds, read from the other side.
Flip the perspective. You've deployed a workload. Some dependency had a CVE, or a test app was exposed on NodePort by accident, or a supply-chain compromise landed an RCE in a library you vendored last quarter. Either way, an attacker has code execution inside a Pod.
What do they see in the first 60 seconds? The same window we've been staring at, from the other side.
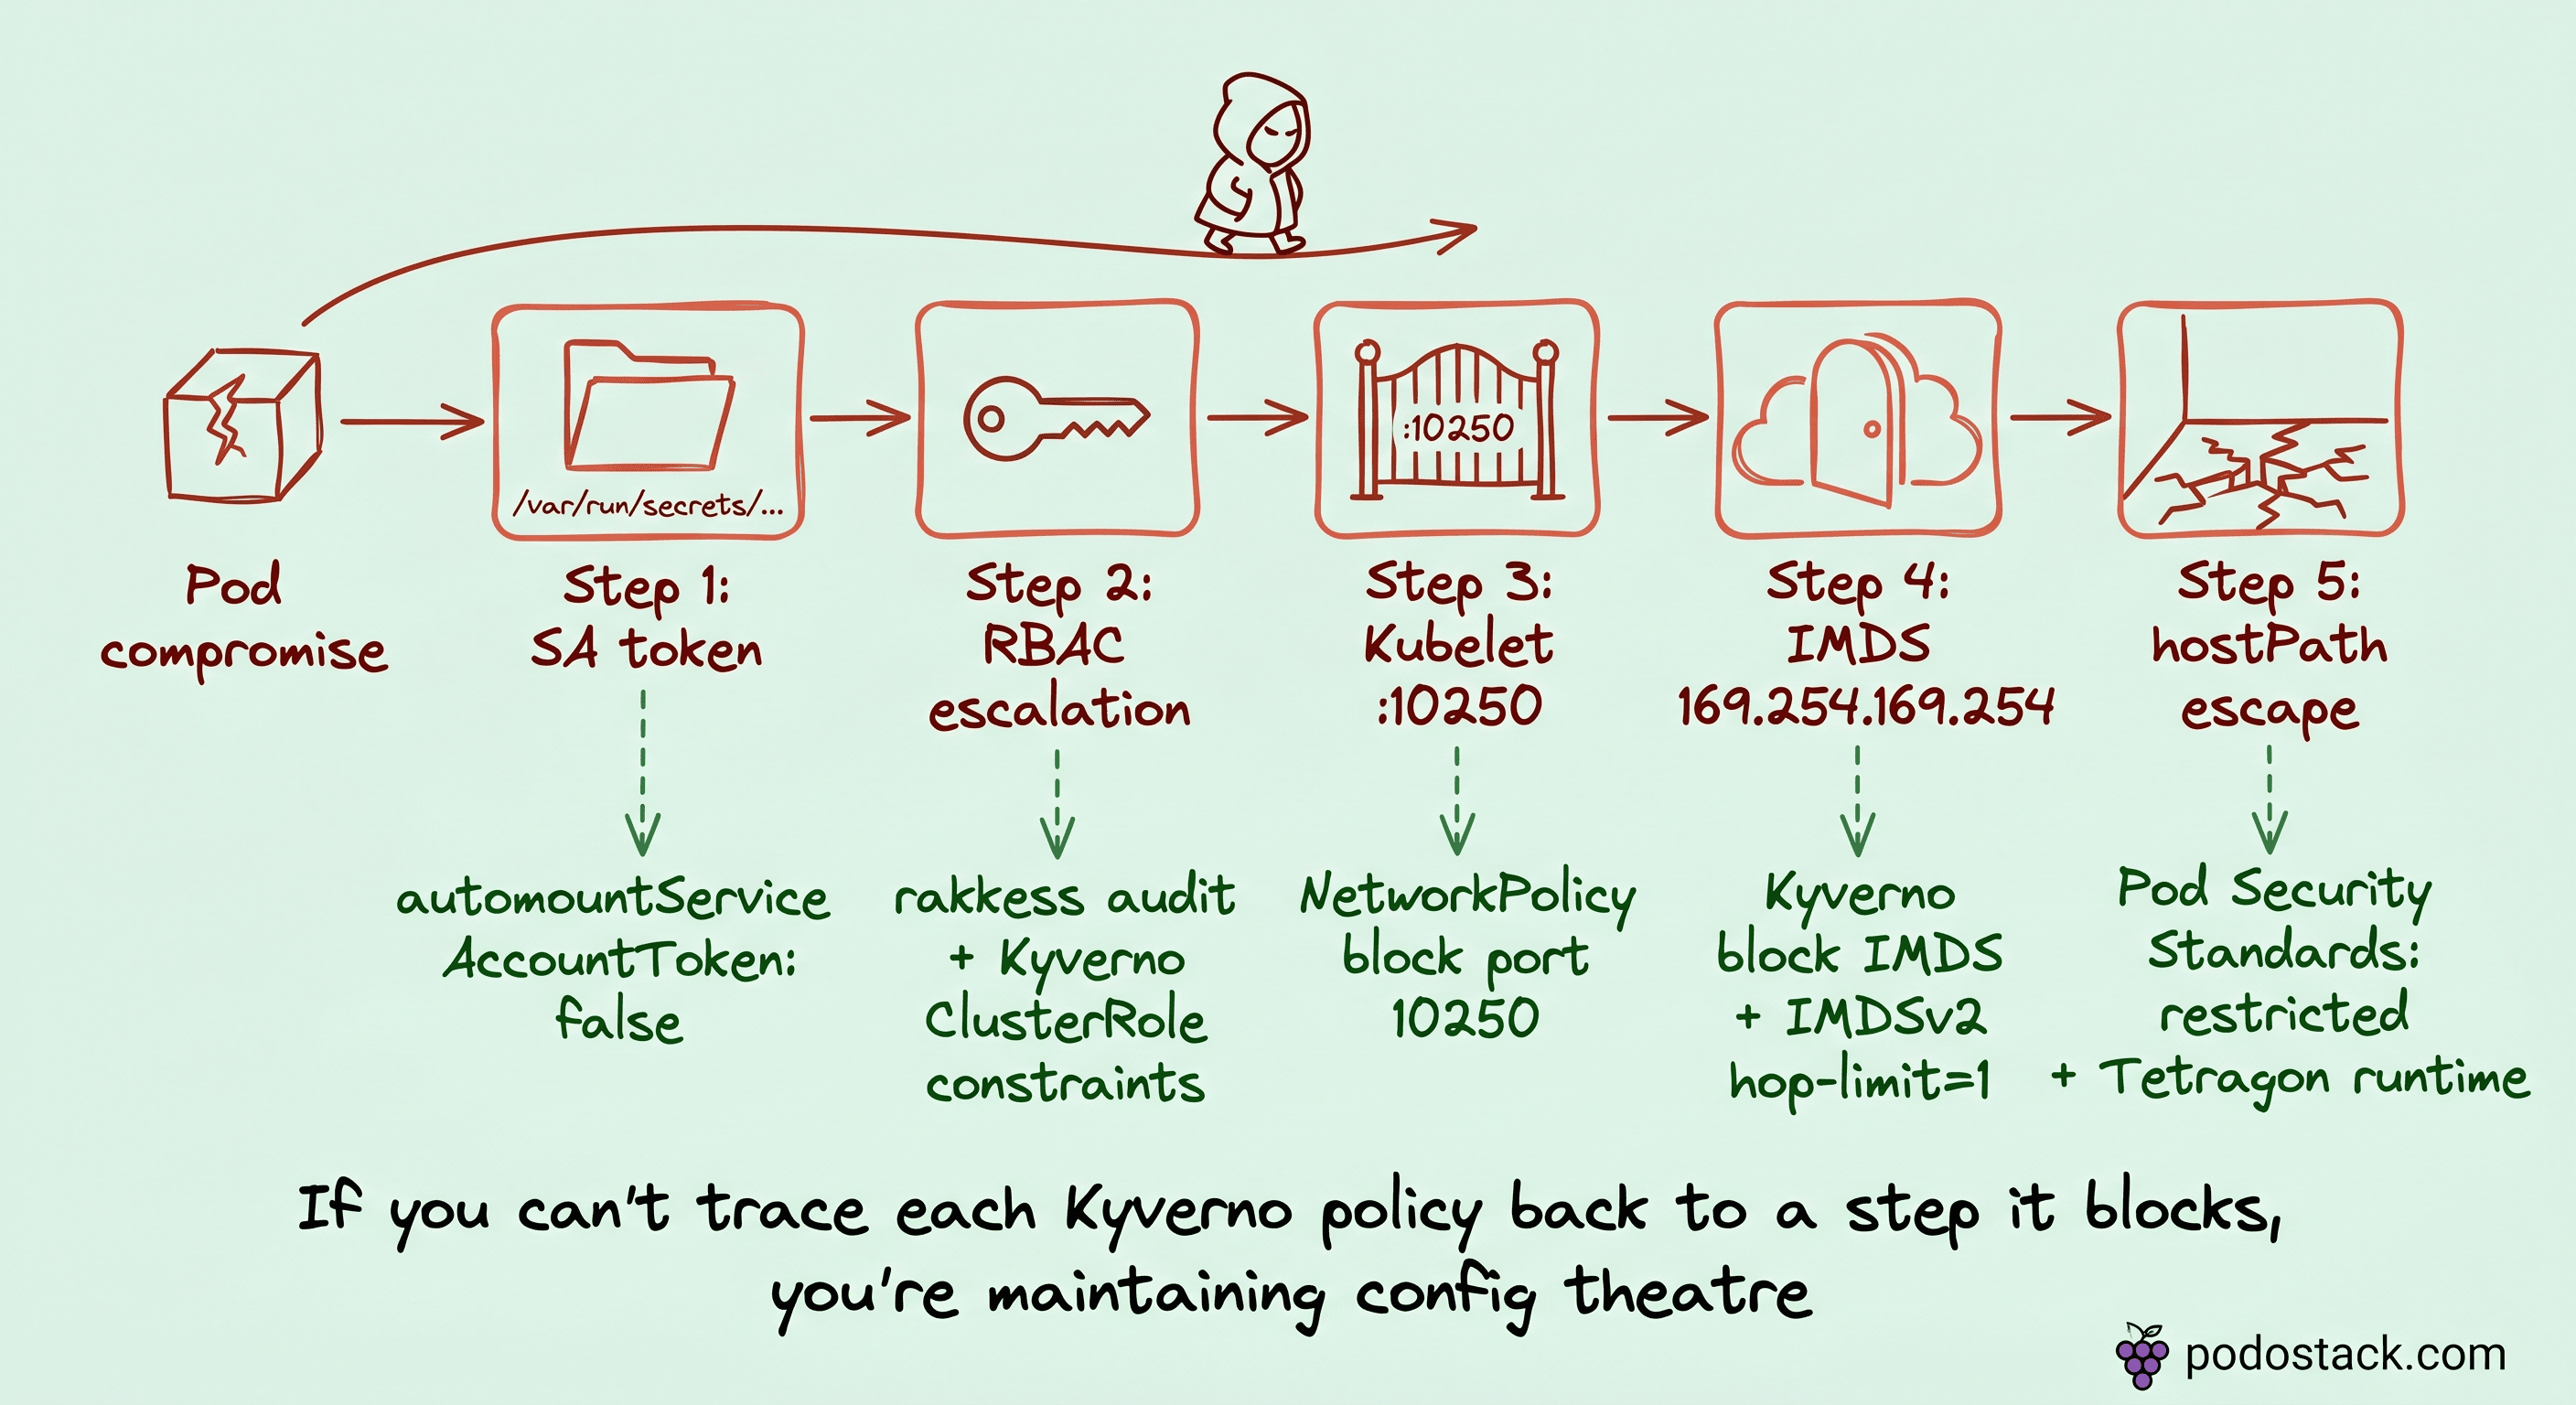
Step 1 - Service Account token./var/run/secrets/kubernetes.io/serviceaccount/token is mounted by default unless you disabled it. kubectl auth can-i --list with that token enumerates the SA's reach. Most workloads carry more RBAC than they need because defaults accrete across Helm chart generations.
Step 2 - RBAC escalation. Typical wins: create pods in kube-system, exec into arbitrary pods, patch clusterrole, bind clusterrole to a new SA. None of these should live in an application SA, and all are common in real clusters.
Step 3 - Kubelet API on neighbor nodes. Port 10250 on every node speaks the Kubelet API. With the right token or relaxed auth, kubeletctl exec's into any pod on that node, reads the secrets mounted there, pivots through the node without ever touching kube-apiserver. Audit logs won't show this path - the apiserver never saw the call.
Step 4 - IMDS.169.254.169.254 is the cloud metadata endpoint. On AWS, it hands over the node's IAM role credentials if IMDSv2 with hop-limit 1 isn't enforced. From there, an AssumeRole chain takes the attacker out of Kubernetes entirely and into your AWS/GCP/Azure account.
Step 5 - hostPath or hostPID escape. If your cluster allows privileged pods anywhere, the attacker mints a new Pod with hostPath: / and reads the kubelet's kubeconfig directly. Now they are the kubelet.
Each step maps to a defensive control most platforms already own:
SA over-reach → Kyverno policy restricting SA permissions, plus explicit
automountServiceAccountToken: falsewhere safeRBAC escalation → audit with
rakkessorkubectl-who-can, Kyverno ClusterRole constraintsKubelet port 10250 → NetworkPolicy blocking the port between namespaces
IMDS → Kyverno policy blocking metadata access from workload pods
hostPath escape → Pod Security Standards at
restricted, plus Tetragon runtime policy
The offensive view is what gives the defensive policy corpus its meaning. Most clusters ship 80+ Kyverno policies as a checklist. If you can't trace each one back to an attack step it blocks, you're maintaining config theatre. And config theatre expires - someone refactors a policy for "clarity", the mapping it was guarding gets lost, and you find out three years later during an incident review.
References worth keeping near the desk: CIS Kubernetes Benchmark, NIST SP 800-190, OWASP Kubernetes Top Ten, OWASP Kubernetes Goat (a lab you can practice against in a kind cluster).
Next week's issue is the defensive half of this story - Kyverno beyond admission, the governance layer that makes this policy corpus hold together.
Links
Closing
Demos ship. Production ships. Between those, four silent failures share one trait - they only show up under contention or compromise:
cgroup weight that makes your pod 40% of the priority it thinks it has
image pull stalls nobody attributed to cold start
neighbor pods eating your cache while everyone blames your code
an attacker's pivot chain that starts exactly where your platform stops looking
The first 60 seconds of a pod's life are where demos lie and where platform engineering earns its keep.
Which of these did you find the hard way? Reply and tell me - cgroup drift, image pull tail, noisy neighbor P99, or a compromised SA token. I'm collecting stories for a future issue.
- Ilia