
Pod shutdown: the 30-second default that silently drops requests
SIGTERM signal, preStop hook, terminationGracePeriodSeconds, in-flight request drain, connection draining

The first cluster I dug into this on was running clean rolling updates by every dashboard the team had, clean enough that nobody had ever investigated the thin band of 5xx that showed up on the edge during deploys. I wouldn't have either. Then a customer complained about a specific minute on a Tuesday, I traced it to a redeploy that had finished six seconds before that minute started, and I had a real example to chase. The dropped requests were happening inside the pod-termination sequence itself. The kubelet was sending SIGTERM to the container before the Service had finished removing that pod from its endpoints, which left a window where kube-proxy on at least one node was still routing fresh traffic into a process that had already started shutting down. The default terminationGracePeriodSeconds of 30 seconds doesn't help when the gap is on the front end of the drain. Issue #15 covered the cold-start side of the pod lifecycle. This one is about what I learned over the next two months reading kubelet source and rolling preStop hooks across most of our Deployments.
The rolling-update bug nobody attributes
Every team I've helped with this has had the same dashboard pattern. The deployment rolls. P99 spikes for a couple of minutes. A thin band of 5xx shows up on the edge graph. Then everything settles. Nobody pages. The release notes say "no impact" and somebody files a vague ticket about flaky deploys that sits in the backlog forever. I'd seen this graph on three different clusters before I traced what was actually happening, and on two of those I'd assumed it was a load balancer issue.
The 5xx come from inside the pod-termination sequence itself, because two events that look simultaneous on a deploy timeline are actually racing. On one side, the Service stops sending traffic to this pod after the EndpointSlice update has propagated everywhere. On the other, the kubelet sends SIGTERM to the container's PID 1 without waiting for that propagation. Whichever wins decides whether in-flight requests get drained or truncated mid-response. Kubernetes loses that race by default more often than the docs admit, and I've now seen the fix land cleanly on three production clusters with the same twelve lines of YAML.
What happens between kubectl delete and SIGKILL
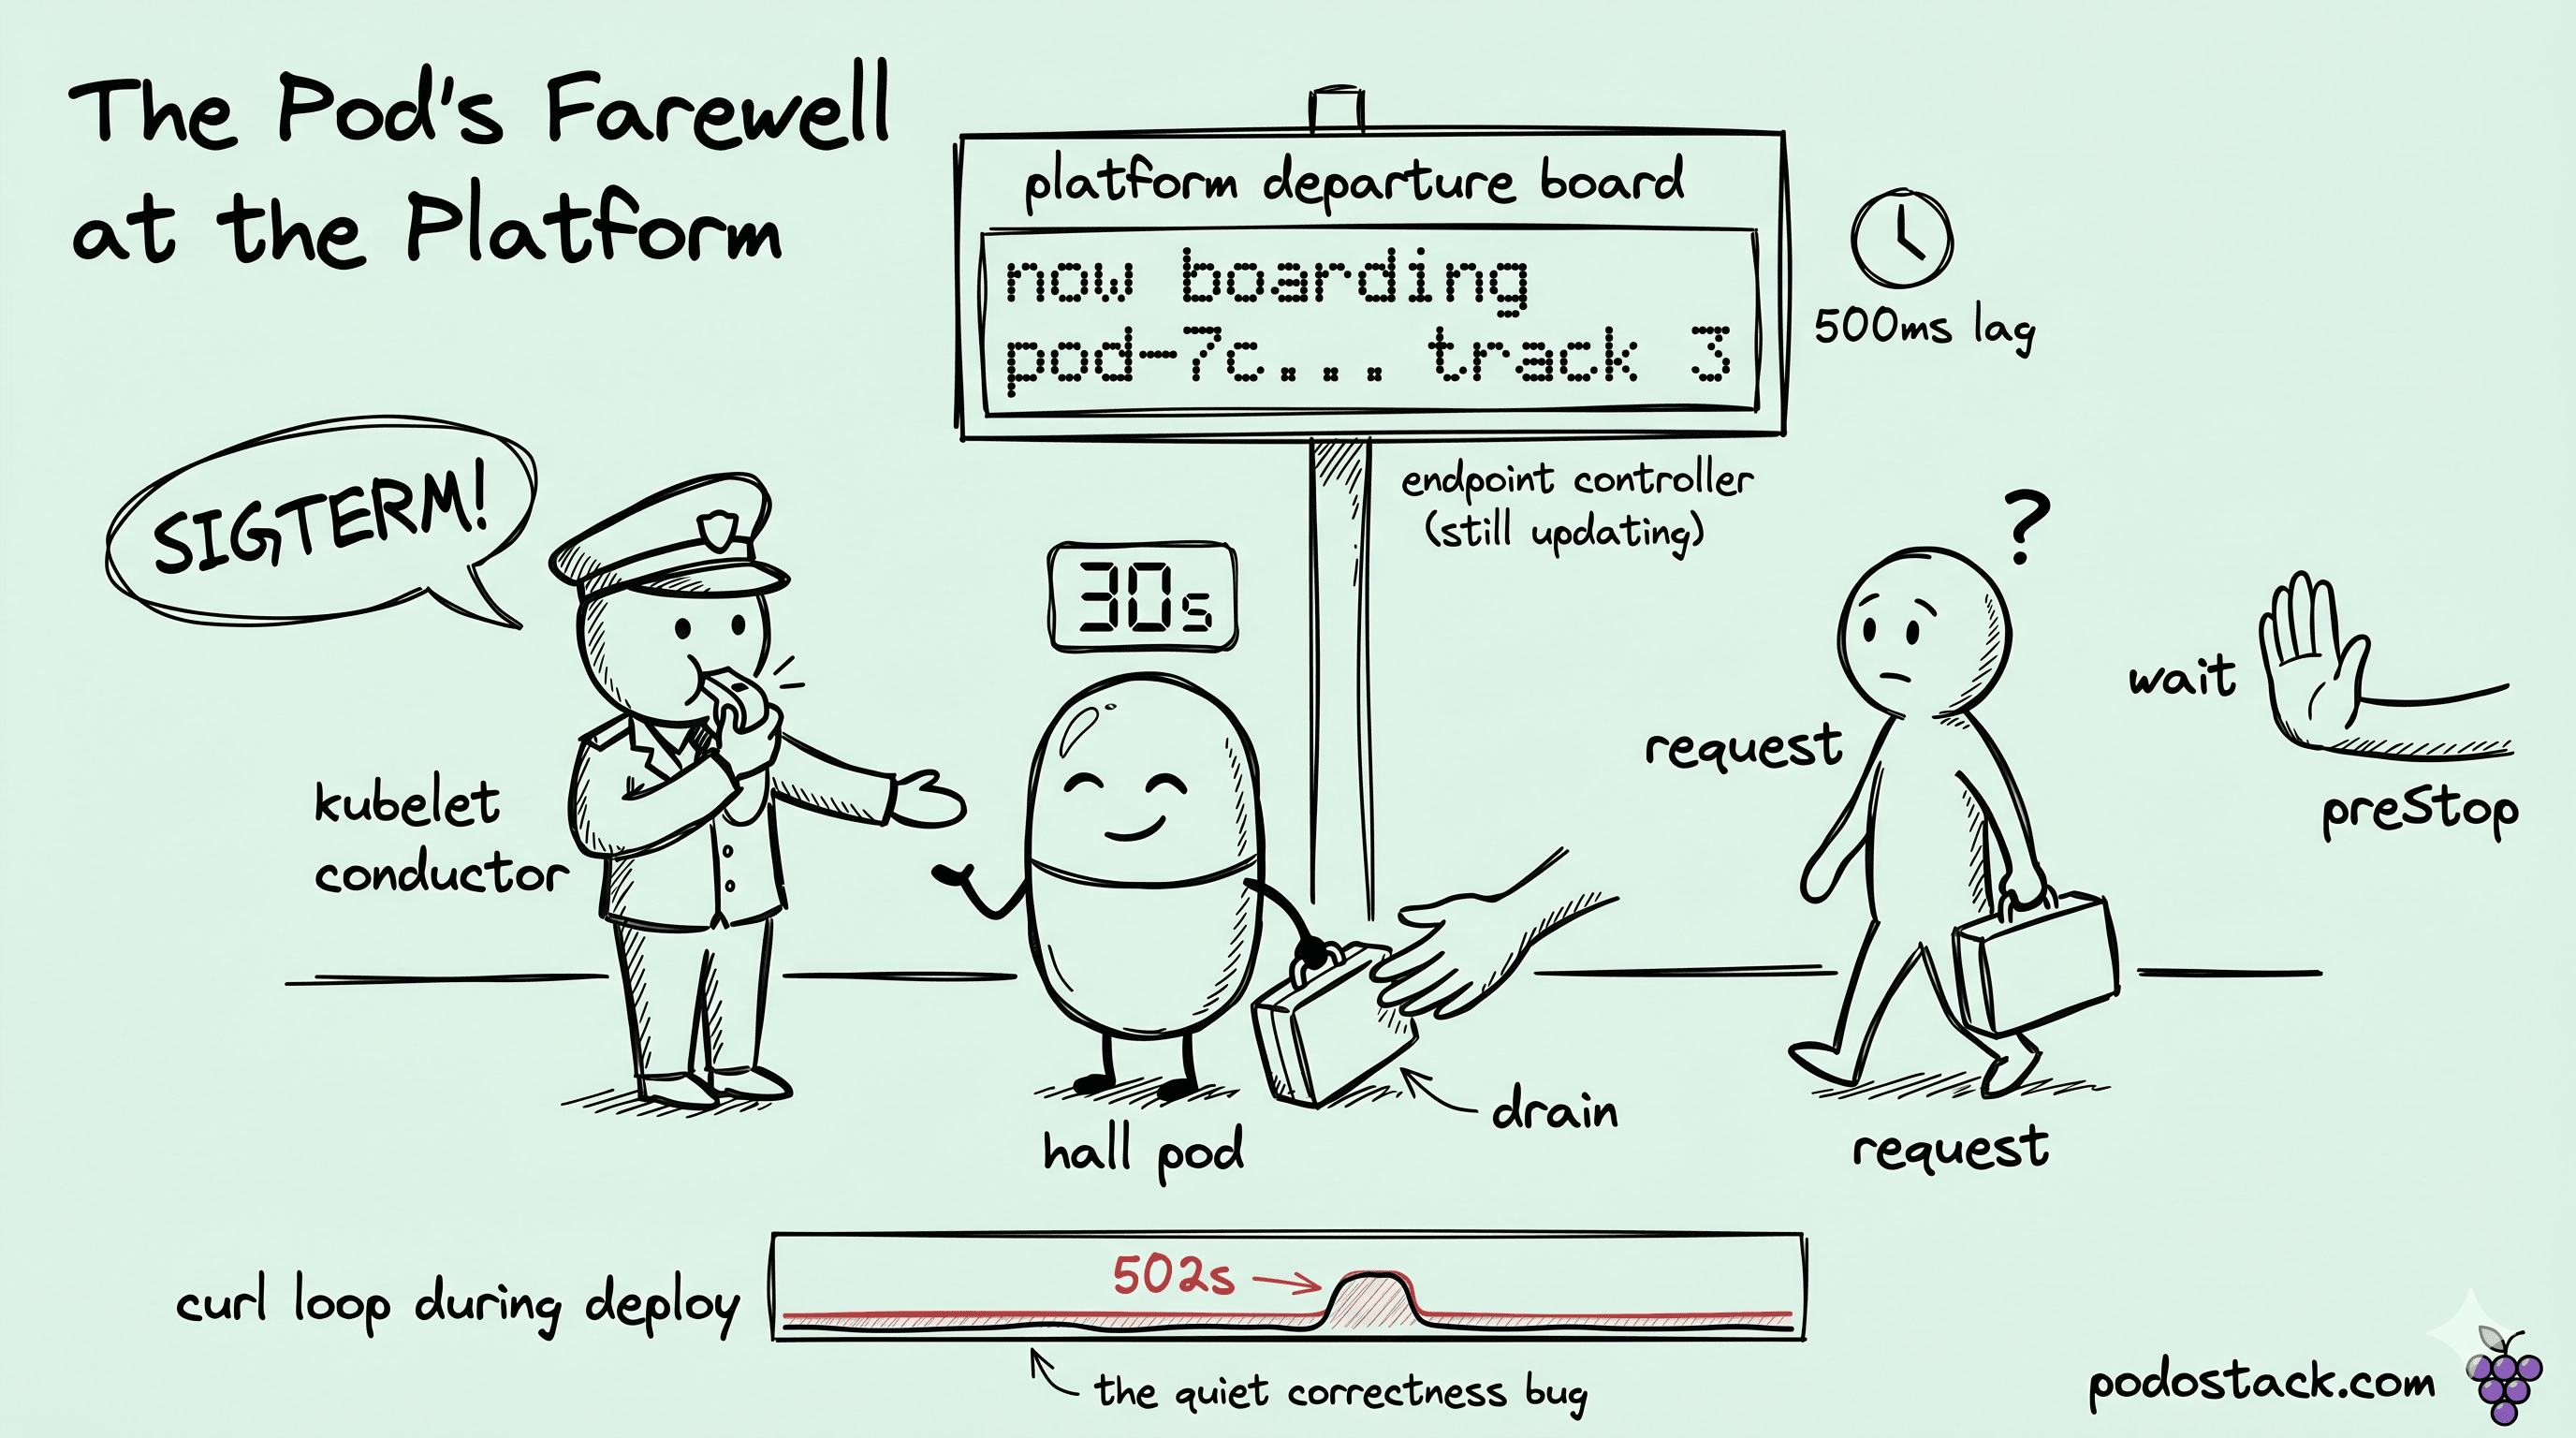
When I ran kubectl delete pod and started watching what the apiserver actually did, what surprised me first was how little the kubelet talks to anything else. The apiserver sets deletionTimestamp on the pod and flips it to phase: Terminating. From there two things happen in parallel, and that parallelism is where my bug was living.
One side is the endpoint controller seeing the new deletionTimestamp, updating the EndpointSlice to remove this pod's IP, and pushing the change out. Every kube-proxy on every node picks up that update and rewrites iptables or IPVS rules. The numbers I measured on a quiet test cluster came in around 200 ms. On the busier cluster from the Tuesday incident, propagation was closer to 2 seconds with a long tail on a couple of nodes.
The other side runs entirely in parallel. The kubelet on the pod's node runs the preStop hook if there is one, waits for it to return, then sends SIGTERM to the container's PID 1. The kubelet doesn't check endpoint propagation. The kubelet doesn't even know it's happening. So with no preStop, SIGTERM lands before kube-proxy on some other node has gotten the memo, and that's where my 5xx had been coming from for years.
Once SIGTERM fires, the kubelet starts a terminationGracePeriodSeconds countdown. Default 30 seconds. That's the window the app has to finish whatever's in flight. If the container hasn't exited when the clock runs out, the kubelet sends SIGKILL. No drain. The kernel reaps the process. Anything mid-write is gone. The first time I caught this hurting us, it was a half-committed WAL entry that survived SIGKILL by maybe 200 ms, leaked one more replication step before the kernel reaped the process, and put the new replica into a state that recovery couldn't reconcile against. We tracked it down four days after the rollout had finished, with stale numbers in a downstream system being the only clue.
After SIGKILL, the apiserver finishes the deletion path. The Deployment controller schedules a replacement pod, and the IP eventually gets recycled.
A clean timeline for a default pod:
t=0.00s   kubectl delete (or Deployment rollout)
t=0.01s   pod.deletionTimestamp set; phase=Terminating
t=0.01s   kubelet: preStop runs (if any)
t=0.01s   endpoint controller: removes pod from EndpointSlice
t=0.20s   kube-proxy on most nodes: iptables/IPVS updated
t=0.50s   kube-proxy on slow nodes: still routing to this pod
t=0.01s   kubelet: SIGTERM to container PID 1
t=30.00s  kubelet: SIGKILL if still running
That overlap between t=0.01 and t=0.50 is where my Tuesday-incident 5xx had been living. The SIGTERM timestamp and the kube-proxy-updated timestamp don't have a guaranteed ordering on any cluster I've touched. The kubelet doesn't talk to the endpoint controller, and nothing in the system synchronizes them.
Why endpoints removal lags SIGTERM
Once I started measuring each hop, the slowness started making sense. The endpoint controller in kube-controller-manager watches the Pod API. It picks up the deletionTimestamp and computes the new EndpointSlice membership, then writes that back to the apiserver. Two API round-trips, fast.
The apiserver fans that EndpointSlice update out to every watcher. On the cluster where I first measured this, that meant kube-proxy on every node plus the in-cluster service mesh control plane plus the external load-balancer controller. About 200 watchers all getting the update over their watch channels at once.
The piece I had underestimated for embarrassingly long was kube-proxy on each node processing that update. iptables mode rewrites rule chains, which is O(services × endpoints), and on the cluster that finally made me read the source we had around 3,000 Services. I watched iptables updates take 4+ seconds during rollouts on that one. That's the entire reason teams move to IPVS or eBPF, though IPVS isn't instant either.
Conntrack is the part I lost the most time on. Linux's connection tracker remembers the destination of every flow, so even after kube-proxy updates the iptables rules, existing TCP connections keep flowing to the old pod until they close on their own. UDP behaves the same way up to the conntrack timeout. The rule update completing in 50 ms had made me think the network had converged when it hadn't, and I spent a couple of evenings chasing the wrong layer before someone on the SRE team showed me conntrack -L. Watching one flow still routing to a Terminating pod made the mental model click.
The numbers I see on production clusters now: from deletionTimestamp to "no more new connections arriving at this pod from anywhere", typically 500ms to several seconds. SIGTERM lands instantly. Whatever drain logic the app has is running against a clock that started before the network had finished telling other nodes the pod was leaving.
The preStop lifecycle hook done right
preStop is the only lever I've found to make the kubelet wait. It runs ahead of SIGTERM. The kubelet blocks on it before the grace-period timer starts at all. That's where I bridge the endpoint-propagation gap on every cluster I touch now.
The simplest preStop that actually fixed the Tuesday incident was a sleep:
lifecycle:
  preStop:
    exec:
      command: ["/bin/sh", "-c", "sleep 10"]
I deployed that across the top fifteen Deployments on the cluster the week after my investigation finished. The 5xx band on the next rollout was gone. Not narrower, gone. I refreshed the edge dashboard expecting to see something and instead saw a flat line where the band had always been.
For an HTTP server I want it slightly smarter. Flip readiness to false first, so external load balancers also see the change, then sleep, then let SIGTERM through:
lifecycle:
  preStop:
    exec:
      command:
        - /bin/sh
        - -c
        - "touch /tmp/shutting-down && sleep 15"
The readiness probe reads /tmp/shutting-down and reports unhealthy when the file appears. External LBs, the Service, and the app all converge on the same state before any connection draining starts. I've been running this pattern in production for a couple of years now and it survives most edge cases I've thrown at it.
The first time I traced this on an nginx pod was the easiest fix I've shipped. nginx -s quit was already doing the drain on its own, refusing new connections and letting in-flight ones close cleanly, so all I had to do was wire it into preStop and skip the sleep. Envoy has the same pattern with /healthcheck/fail followed by a delayed shutdown. Most HTTP frameworks ship an equivalent graceful-shutdown call you trigger from a SIGTERM handler, and I usually pair that with a small preStop sleep to cover the endpoint-removal lag before the listener actually closes.
Queue workers behave nothing like web servers in this regard. The team I helped with one queue cluster had jobs holding distributed locks, and when their preStop killed the worker without releasing those locks, the next replica had to wait out the lease timeout before it could retry. They'd been losing half the messages on every redeploy for six months. After we measured the actual longest job, the grace period on that workload had to come up to 120 seconds before redeploys stopped losing messages. Whatever the longest job actually takes is the floor for me now, and I don't trust intuition on it anymore.
A different cluster I helped on had a Postgres pool of about 50 connections with active transactions, and we found that draining cleanly took 30+ seconds on its own. Each in-flight transaction had to commit or roll back before the connection released. We ended up at 60s grace there before the new replica's pool stopped seeing connection errors at startup.
Tuning terminationGracePeriodSeconds
I keep finding 30 seconds wrong, in both directions, on the workloads I look at.
It's been too short on basically every stateful workload I've touched since the Tuesday investigation. The queue-worker cluster from earlier ended up at 120 seconds. The Postgres-pool cluster ended up at 60. A team I helped with gRPC streams where clients legitimately took 4+ minutes to wrap up - we ended up disabling SIGKILL entirely for those pods via finalizers and an external watchdog, because no grace period was going to be the right answer for that workload.
In the other direction, on one cluster where I helped the platform team, we wrote a Kyverno mutate policy that defaults grace to 10s for anything labeled tier=web-stateless. Their rolling updates had been taking 5x as long as they needed to, and the platform team kept getting blamed for slow deploys. The 30-second default isn't a conservative choice so much as a number that predates anyone caring about deploy speed at this layer.
The number I keep ending up with, after measuring instead of guessing, is the preStop sleep plus however long the worst in-flight operation can plausibly need, with a small safety margin on top. I set it explicitly:
spec:
  terminationGracePeriodSeconds: 60
  containers:
    - name: api
      lifecycle:
        preStop:
          exec:
            command: ["/bin/sh", "-c", "sleep 10"]
One operational footnote that bit us on a Karpenter upgrade. The Eviction API used by kubectl drain and most node-upgrade tooling (Karpenter included) can cap the grace period regardless of what's in the pod spec. We had tuned grace to 120s for some queue workers, and node drains were still killing them at 30. It took me half a day to find that the eviction path was overriding us. I now check it once on any cluster where I've tuned this.
At SIGKILL there's no second chance. The kernel reaps the process. There's no postStop hook to flush anything, so whatever invariants the app holds in memory had better already be on disk. The first time we traced a Sev-2 back to this was a rolling update that had finished a week before the symptoms surfaced. Someone had bumped replica count, the rollout looked clean to everyone watching it, and a downstream system started returning stale data four days later because abandoned WAL entries had finally caught up with us in the analytics pipeline.
The mistakes I keep seeing on new clusters
The one I see the most on a new cluster is also the simplest: no preStop hook at all. Default config, default grace period, and 5xx errors during deploys that the team has stopped seeing because they've always been there. This is the baseline I now assume on any cluster I haven't worked on before.
A pair of related mistakes travels together. The app catches SIGTERM, logs "shutting down", and immediately calls os.Exit(0), so the signal handler bypasses the drain instead of triggering it. The readiness probe never flips, so preStop runs and the app starts shutting down, but the probe still reports "ready" because nothing told it otherwise, and external LBs keep sending traffic right up to SIGKILL. I've caught both by reading source code. Neither one has ever shown up in a dashboard for me.
The grace-period-shorter-than-drain failure mode is the queue-worker case from earlier, and I've now seen it on three different teams. None of them caught it from monitoring. It always surfaces because somebody manually traces a missing message and the timestamps line up with a redeploy. For each team, the right grace period had to come from measuring the actual longest job, because their intuition about it was off by close to 90 seconds every time.
The preStop-sleep-eats-the-grace-period mistake is sneaky. I spent two hours convinced a team's drain logic was broken before I noticed sleep 30 in their preStop sitting right next to terminationGracePeriodSeconds: 30. SIGKILL was firing the instant preStop returned.
And the one that means none of the above ever gets caught at admission: no policy guardrail. There's no default admission rule enforcing a minimum grace period for stateful workloads, and pods without a preStop hook quietly pass through unflagged. Every new team I've worked with rediscovers the problem the hard way during their first production incident. We eventually wrote Kyverno policies after the third team rediscovered it, and the new-team incidents went away the next month.
The deploys where I'd added preStop: sleep 10 and an honest grace period across the top ten Deployments on the original Tuesday-incident cluster didn't make any noise on rollout day. The 502 band on the next rollout just wasn't there. Nobody filed a ticket. The bug had only ever surfaced as the vague flaky deploys ticket sitting in the backlog forever, so the absence of new tickets was the only thing telling me the fix had landed.