
Flame Graphs in Prod, Prometheus at Scale, and the Signal Nobody Talks About
Continuous Profiling with Pyroscope, Thanos vs VictoriaMetrics, kubectl debug, and an OTel Collector Gateway Pattern

Welcome back to Podo Stack. Six issues in, and we’ve built a real toolkit: image pulling, networking, platform guardrails, supply chain security. But here’s a gap I’ve been ignoring. You can sign every image, scan every build, enforce every policy - and still have no idea why your service is slow at 3 AM on a Tuesday.
This week: observability. Not dashboards. Not “just add Prometheus.” The signals that actually tell you what’s happening - and the fourth one most teams don’t know exists.
🏗️ The Pattern: Four Signals
Three pillars is an incomplete story
Everyone says “metrics, logs, traces.” It’s become a mantra. But Google’s been quietly using a fourth signal for years: continuous profiling. They wrote about it in their Dapper and Google-Wide Profiling papers. The rest of the industry is just catching up.
Here’s what each signal actually answers:
Metrics - “Is something wrong?” Prometheus tells you CPU spiked at 14:32. It doesn’t tell you why.
Logs - “What happened?” You grep through structured logs and find an error. But you still don’t know what code path caused the CPU spike.
Traces - “Where did the time go?” Distributed tracing shows you the request spent 200ms in the payment service. But was that CPU time? Waiting on I/O? Lock contention?
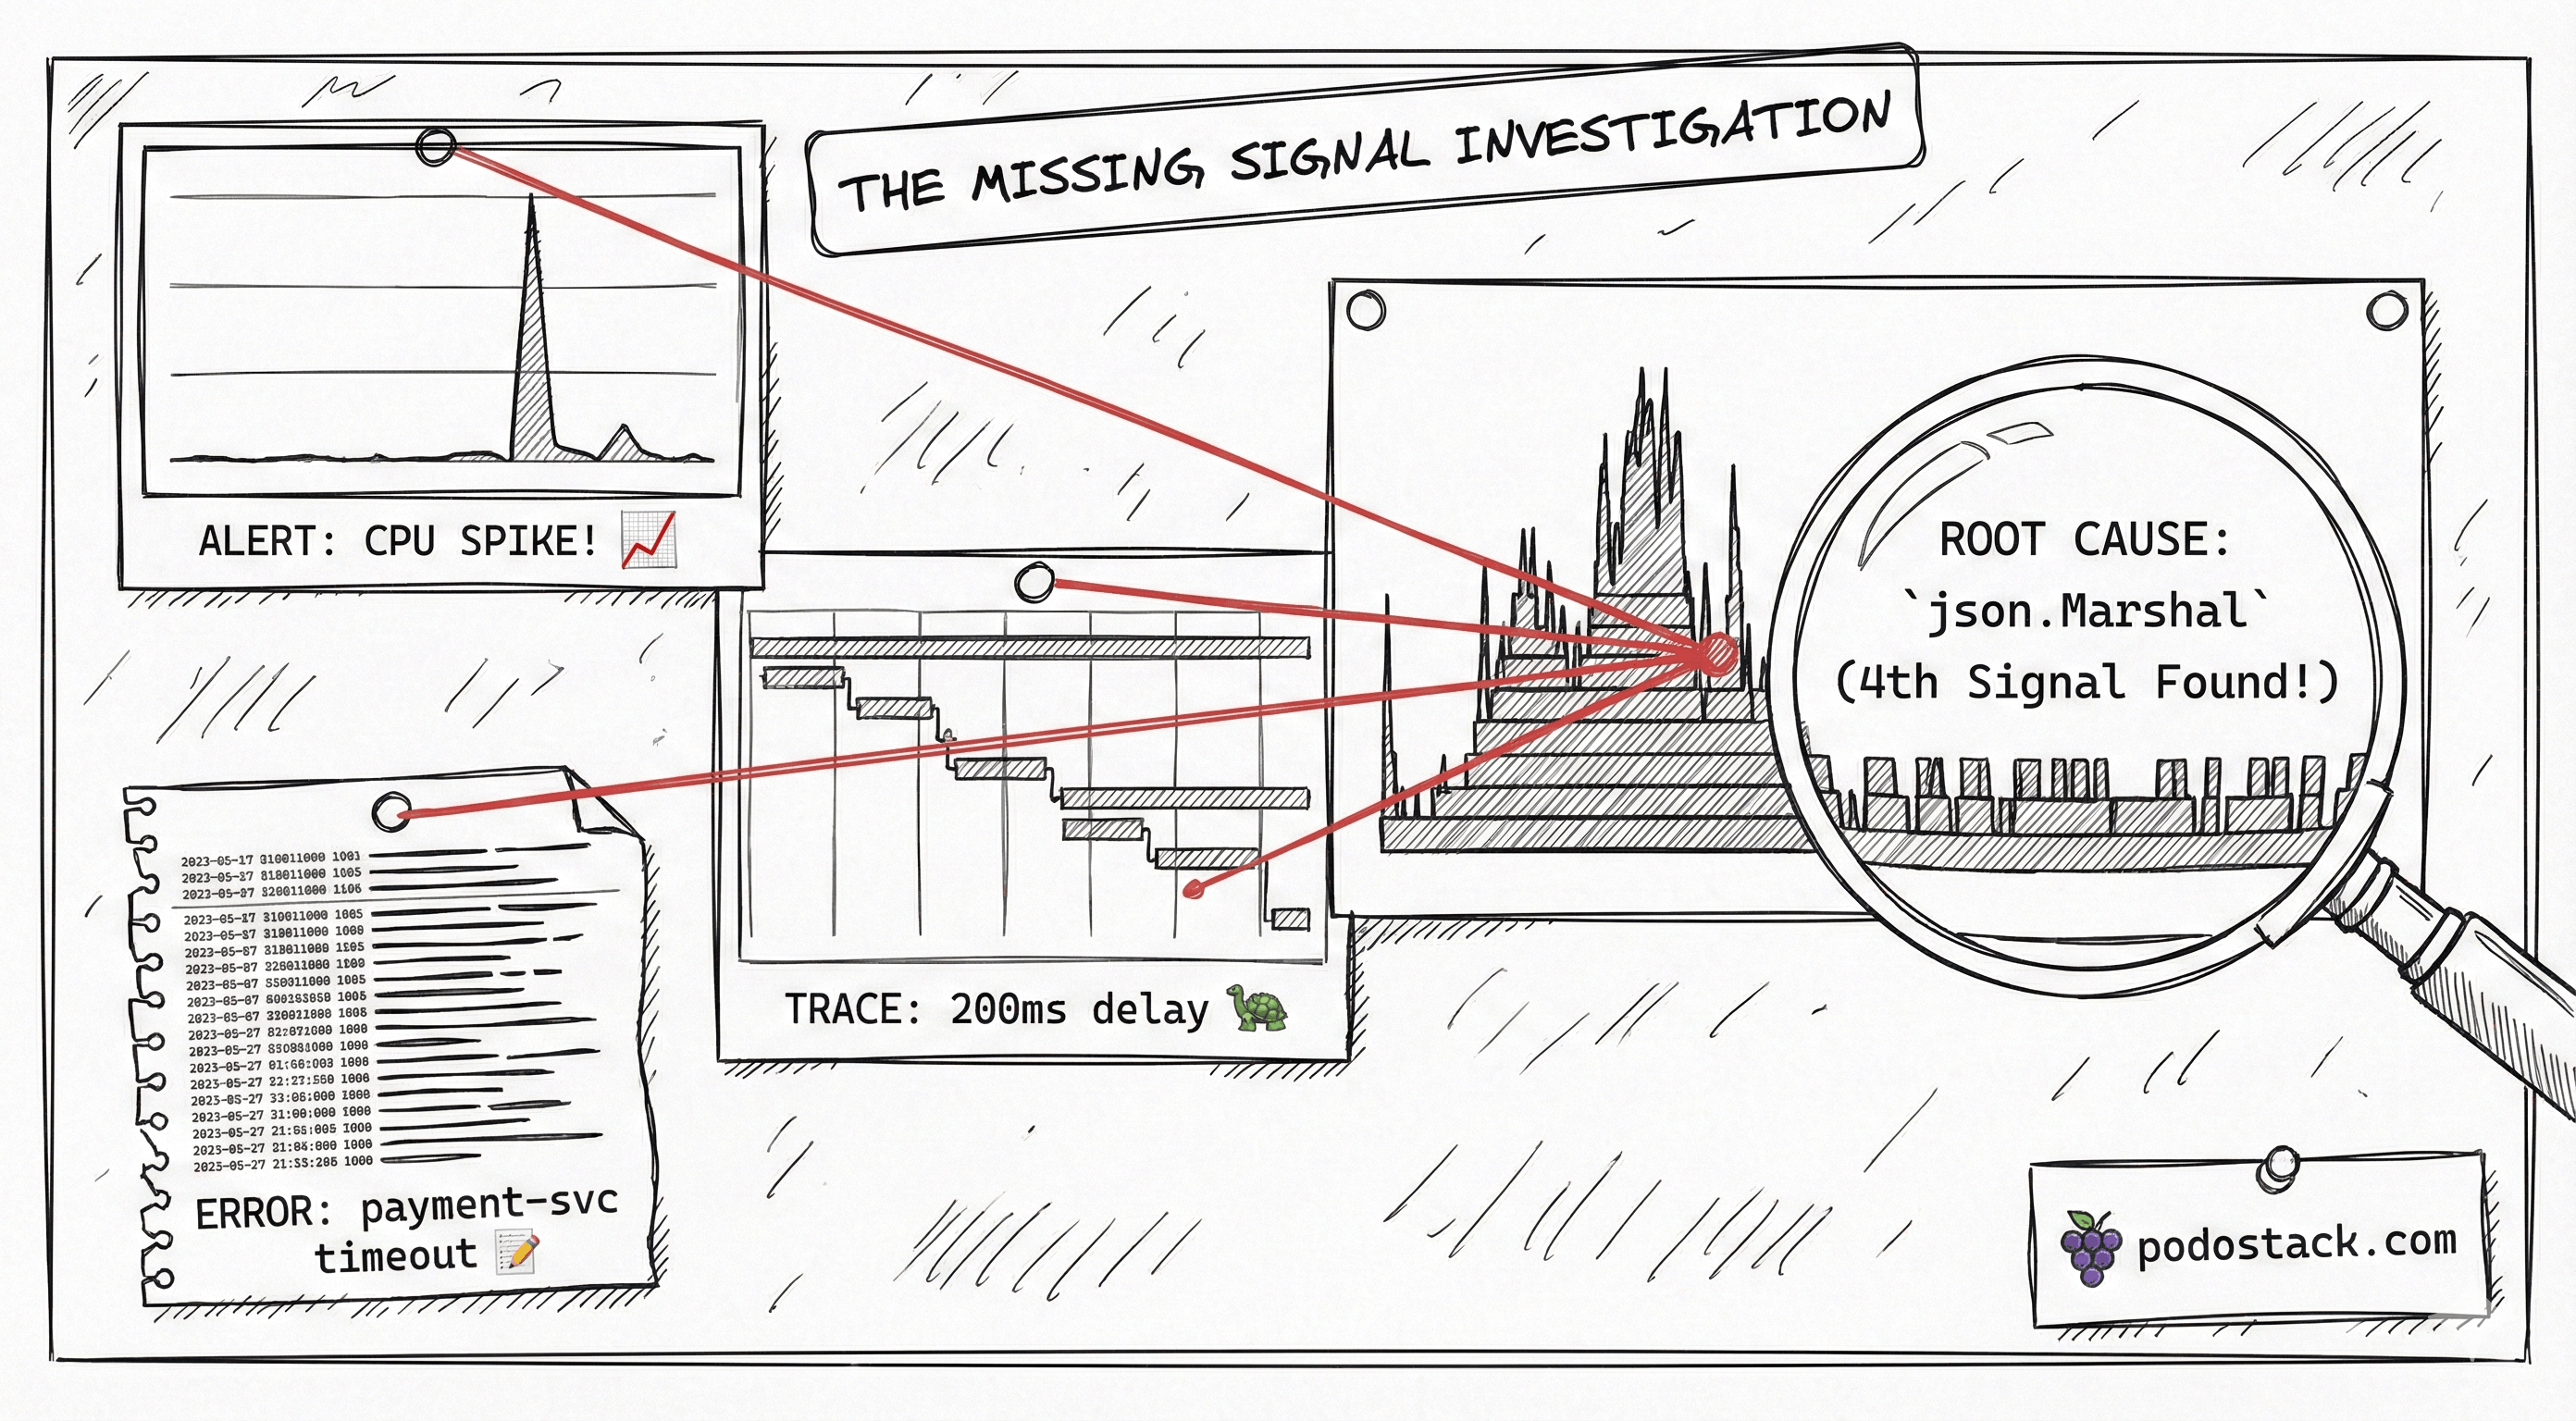
Profiles - “Why is it slow?” Flame graphs show you the exact function eating 40% of your CPU. Not the service. Not the endpoint. The function. Line-level precision.
Metrics detect. Logs explain. Traces localize. Profiles pinpoint. You need all four to go from “something’s wrong” to “I know what to fix” without guessing.
Links
💎 Hidden Gem: Pyroscope
Your APM shows which service is slow. Pyroscope shows which function is slow. Different granularity, different insights.
Pyroscope is now part of Grafana Labs (acquired 2023, integrated into Grafana Cloud). It does continuous profiling - think flame graphs, but always running in production, not just during a debugging session.
How it works
Pyroscope uses lightweight eBPF-based sampling in production. Every 10ms, it captures stack traces across all your processes. Overhead? About 1-2% CPU. The data streams into a storage backend where you can query flame graphs by time range, service, and label.
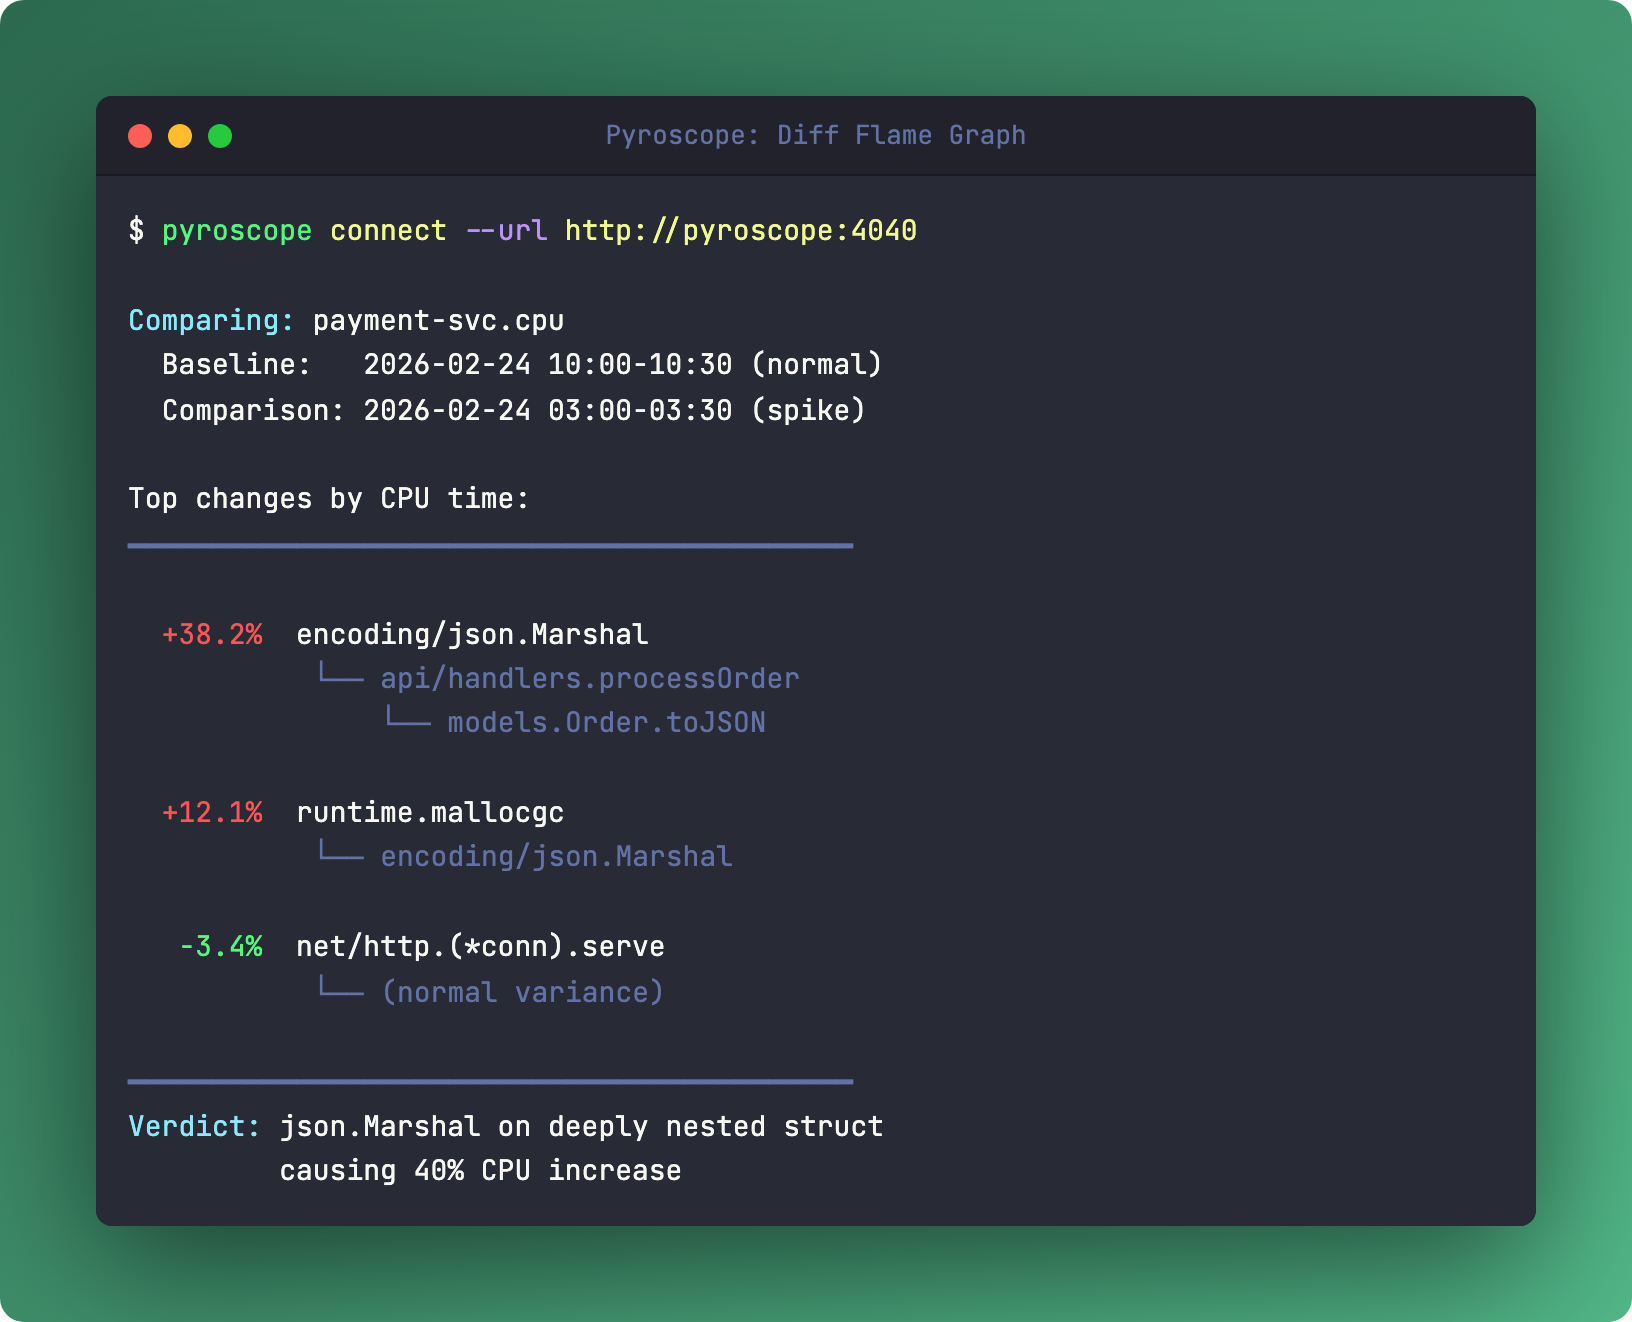
The killer feature: diff flame graphs. Compare Tuesday at 3 AM (when latency spiked) with Tuesday at 10 AM (when everything was fine). The diff shows exactly which functions got hotter. No guessing. No reproducing in staging.
I used this on a Go service that had P99 latency spikes every few hours. Prometheus showed CPU was fine on average. Traces showed the slow requests hit the same code paths as fast ones. The diff flame graph revealed a json.Marshal call that blew up when a particular field contained deeply nested data. Ten minutes from flame graph to fix.
Links
🆚 The Showdown: Thanos vs VictoriaMetrics
Prometheus works great - until it doesn’t. A single Prometheus server holds about 2 weeks of data, can’t do global queries across clusters, and doesn’t survive a node failure. Two approaches to fixing this. Very different philosophies.
Thanos (the sidecar)
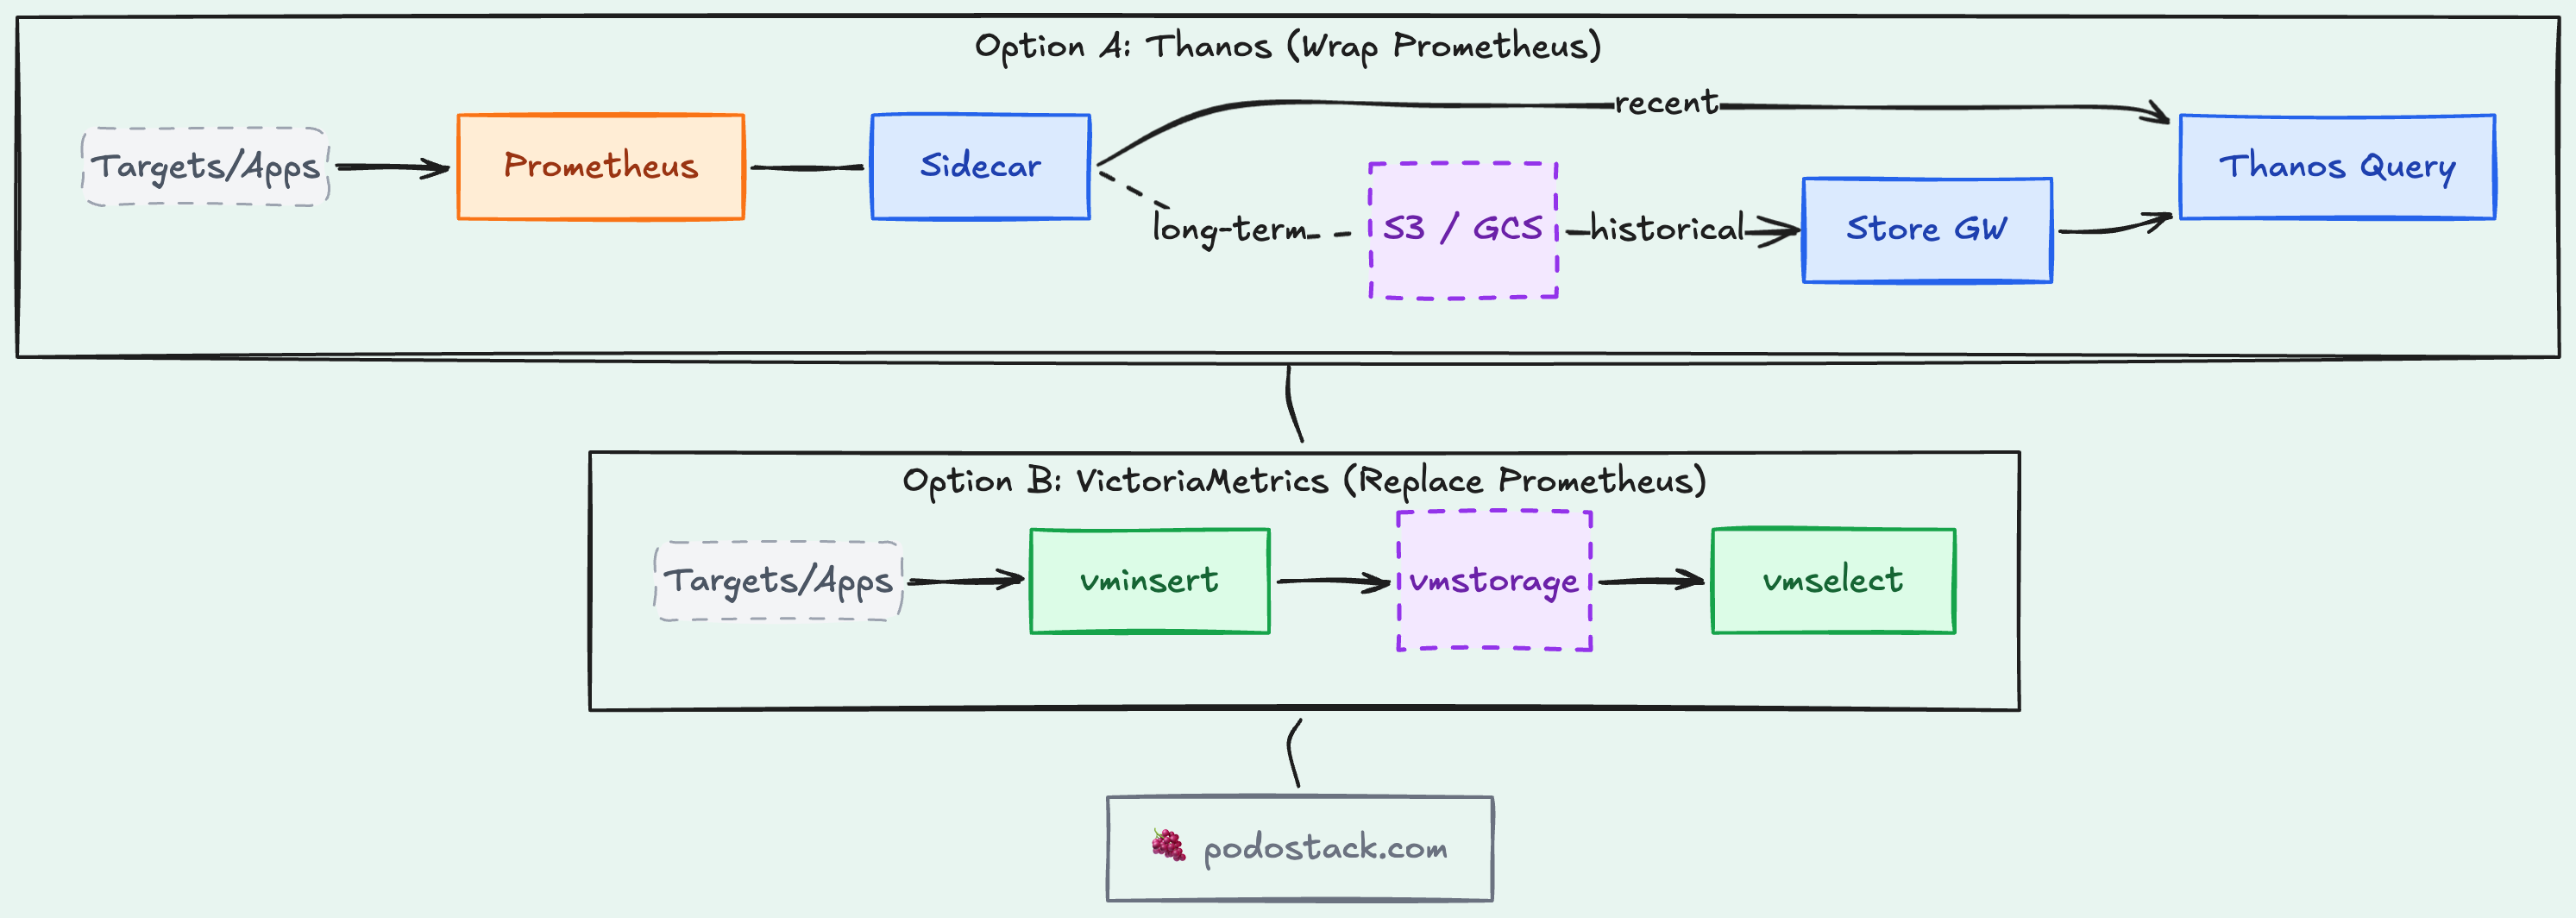
Thanos wraps around your existing Prometheus instances. A sidecar on each Prometheus streams blocks to object storage (S3, GCS). A Query component fans out queries across all your Prometheus instances and the object store. No data migration. No forklift. You keep your Prometheus configs.
Trade-off: more moving parts. Sidecar, Store Gateway, Compactor, Query, Query Frontend. Each one needs monitoring itself. CNCF Incubating project.
VictoriaMetrics (the replacement)
VictoriaMetrics is a Prometheus-compatible TSDB that replaces Prometheus entirely. Same PromQL, same scrape configs, but with better compression (up to 10x), lower memory usage, and built-in clustering. Single binary for small deployments, or a distributed cluster for scale.
Trade-off: it’s not Prometheus. If you rely on Prometheus-specific features (recording rules, alerting configs), migration has friction. But the operational simplicity is hard to beat.
When to choose what
Thanos - you have multiple Prometheus instances across clusters and want global queries without replacing anything. The sidecar approach adds capabilities without disrupting what works.
VictoriaMetrics - you’re hitting Prometheus memory/storage limits and want a simpler stack. Especially if you’re starting fresh or running a single large cluster.
Links
👮 The Pattern: OTel Collector as Gateway
Every team starts the same way. App sends metrics directly to Prometheus. Another app sends traces directly to Jaeger. Logs go to Fluentd. Three pipelines, three configs, three things to maintain. It doesn’t scale.
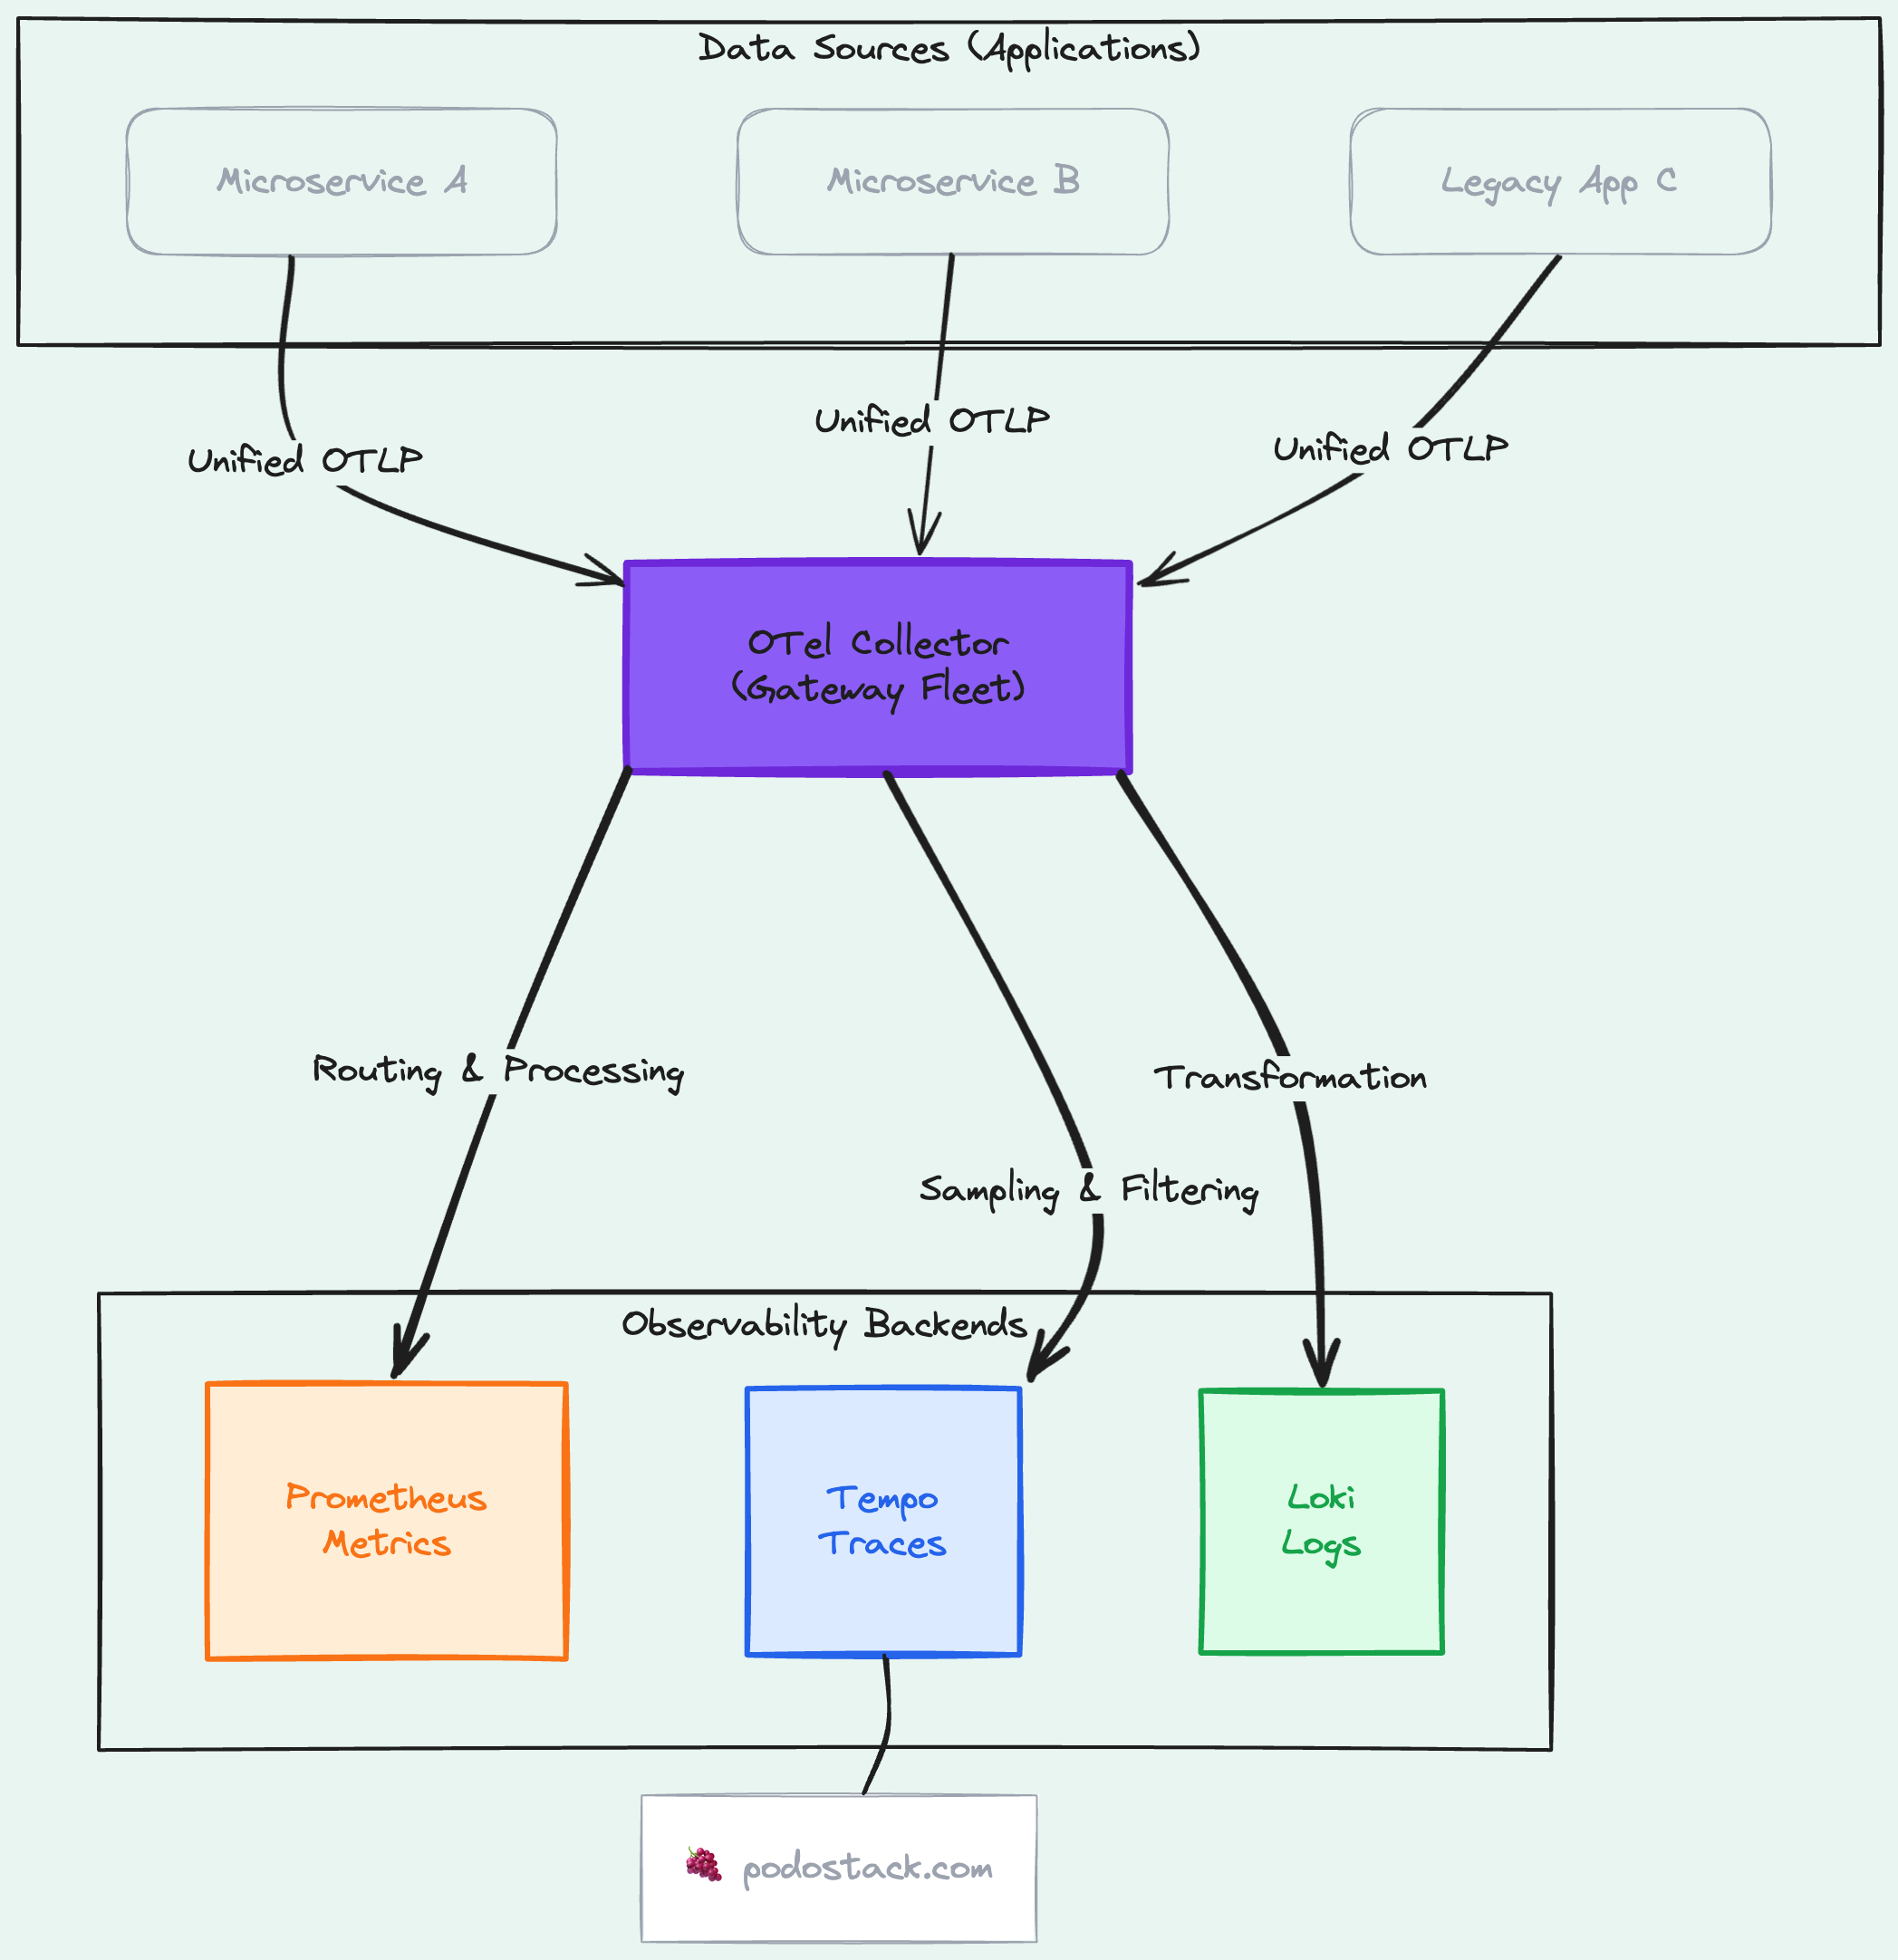
The OpenTelemetry Collector is a vendor-neutral telemetry pipeline. It receives data from your apps (OTLP, Prometheus, Jaeger formats), processes it (filter, transform, batch), and exports it to any backend. One pipeline for all signal types.
Deploy it as a gateway - a central fleet of Collectors that all your services send to. Now you can:
Switch backends without touching application code
Sample traces at the gateway level (keep 100% of errors, 10% of success)
Add metadata (cluster name, environment) in one place
Buffer during backend outages
It’s the difference between “every team configures their own telemetry” and “the platform provides a telemetry API.” If you’re building an IDP from Issue #4, the Collector belongs in your golden path.
Links
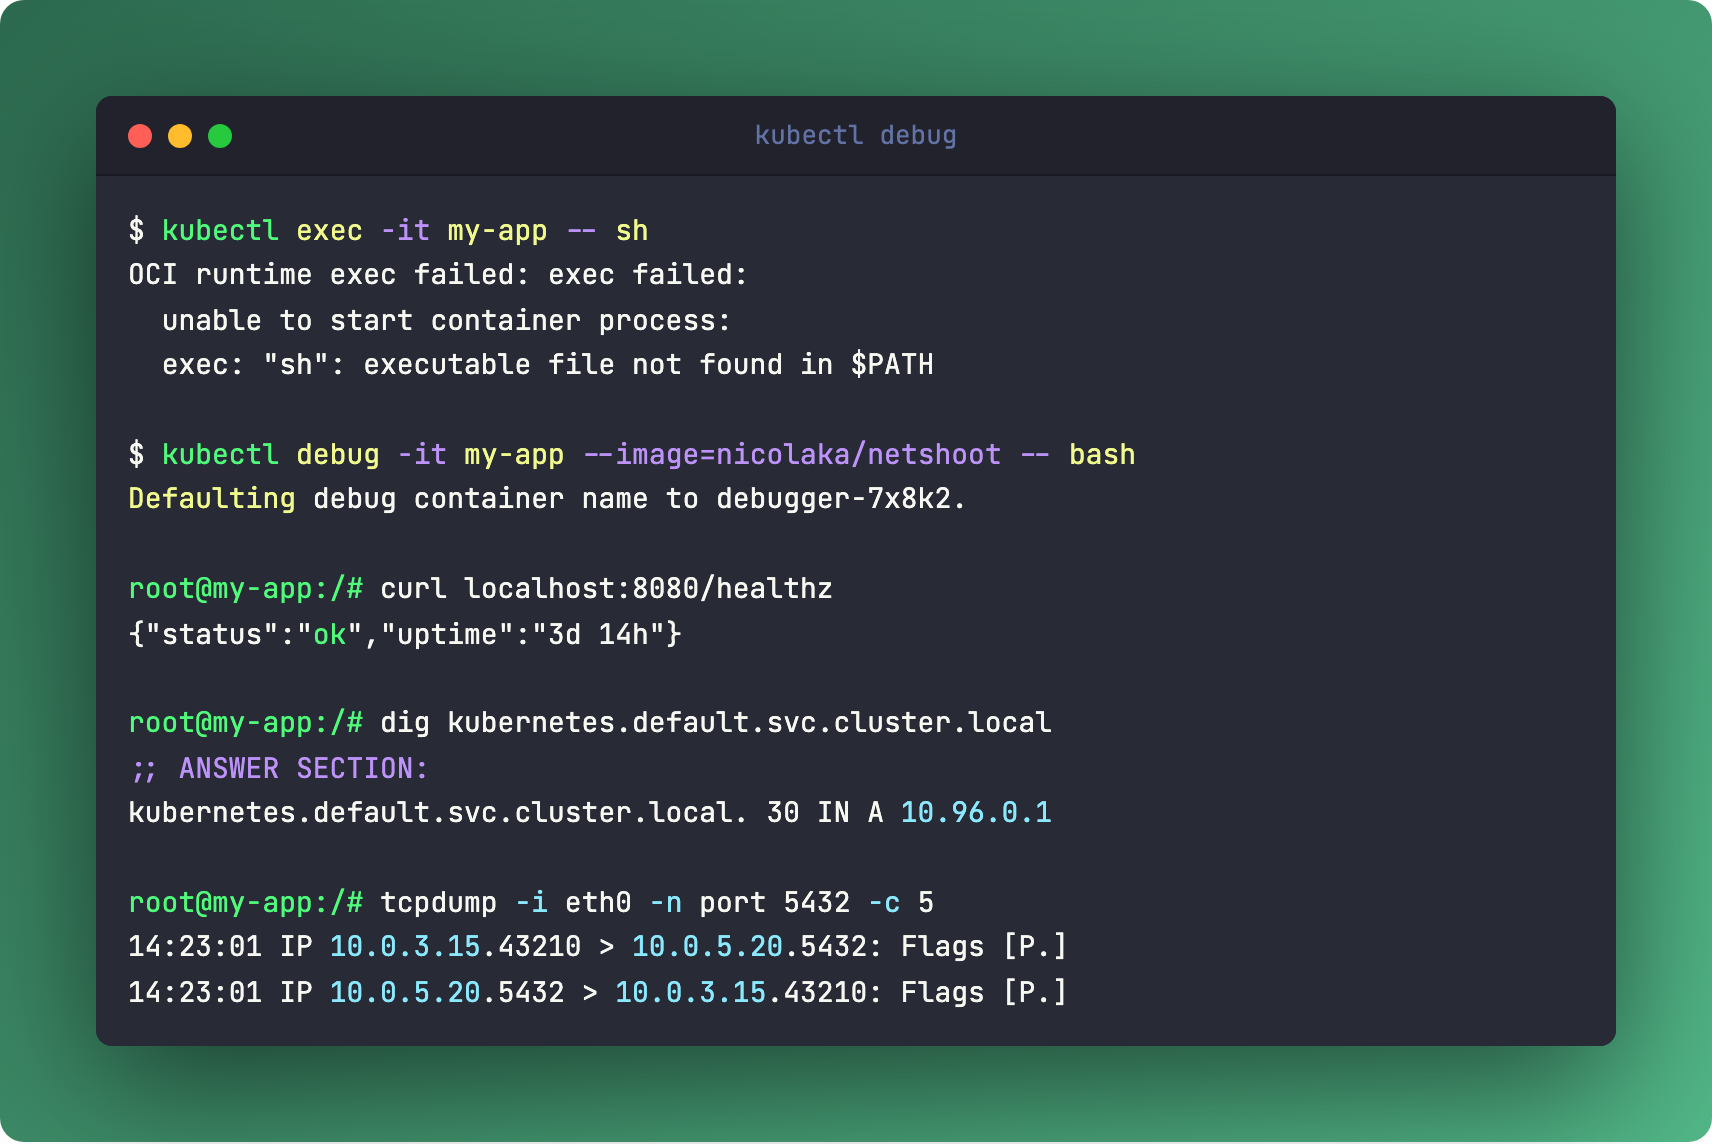
🛠️ The One-Liner: kubectl debug
kubectl debug -it pod/my-app --image=nicolaka/netshoot -- bashAttaches an ephemeral container to a running pod. Full toolkit (curl, dig, tcpdump, strace) without baking debug tools into your production image.
Remember distroless from Issue #5? No shell, no tools, minimal CVEs. kubectl debug is the answer to “but how do I debug it?” You don’t need a shell in your image. You attach one temporarily, debug, and it disappears.
Works with any running pod. No restart required. The ephemeral container shares the pod’s network namespace, so you can test DNS, hit localhost endpoints, capture packets - all without modifying the deployment.
Links
Questions? Feedback? Reply to this email. I read every one.
🍇 Podo Stack - Ripe for Prod.