
OTel collector: the observability gateway nobody scales right
receivers, processors, exporters, memory limiter, batch processing, fan-out, pipeline-aware sampling

The first time our OTel collector OOMed at 4 AM, I spent twenty minutes blaming the network. The pager said dropped spans during peak. The collector's own memory gauge read fine right up until the pod died with a 137. We had one replica funneling every span, metric, and log from about fifty services to three backends, and it had been doing that for months without complaint. That was the problem. It worked on day one with five services, the performance got normalized, and nobody scaled it after we onboarded the rest of the platform.
We treated it like nginx. Deploy the chart, bump replicas if CPU gets hot, move on. The collector is not nginx, and I learned that the hard way over the next two weeks. It's a streaming pipeline carrying three different memory pressures in the same process, sharing one goroutine pool, fanning out to backends that each push back differently. You don't scale it by adding pods. We tried. It bought us four days.
This is what we found when we finally stopped restarting it and read how the thing actually moves data.
The week before the OOM
The symptoms had been there for weeks, and we'd been reading them as noise. The processor's dropped-span counter ticked up at every traffic peak. We logged that as backpressure we could live with. The send-failed counter on the exporter was noisier, but it only climbed when our tracing backend had a bad minute, so that one went on the backend's tab too. The memory graph was the reassuring one - it sawtoothed up each day and back down each night, the way a healthy process should, right until the Tuesday it didn't. The pod died, a new replica booted, and our APM graphs went blank for three minutes while it did.
What kept me restarting the pod instead of fixing it was the limiter. I checked twice that night that we had one configured, because I'd assumed a missing limiter was the whole bug. It was there. It just sat at a healthy number while the pod died around it. The heap profile I pulled at 4:40 showed why: the process had climbed 200 MB inside a single one-second check interval and OOMed before the limiter ever sampled. The gauge wasn't lying so much as I'd misread what it measured.
We'd inherited the default otelcol-contrib chart. One replica. The values file has a comment that says "scale as needed," and we never did. The collector quietly buffered more and more under load until it fell over, and the only outward sign was three-minute holes in dashboards that read like a flaky backend, not a dying collector.
Links
OpenTelemetry Collector: memory_limiter processor - check_interval, limit_mib, and spike_limit_mib, and why it refuses input instead of capping memory.
OpenTelemetry Collector docs - what the collector is, and the otelcol-contrib distribution whose chart ships one replica.
The pipeline is a graph, not a config file
Once I started picturing the collector as a graph instead of a block of YAML, the failures stopped looking random. A pipeline is a tuple - some receivers, an ordered chain of processors, some exporters - and you run several of them in one process, usually one per signal type. We had exactly one, and that turned out to be the second thing wrong.
Each pipeline gets its own goroutine set for the processor chain. Receivers run their own goroutines feeding in, exporters drain from the end, and the connecting tissue is a series of in-memory queues. The night it fell over, our tracing backend slowed down for ninety seconds. The exporter queue backed up, which backed up the processor, which backed up the receiver - and because we'd shoved traces, metrics, and logs through one shared pipeline, the slow trace backend took our metrics down with it. We lost CPU dashboards during an incident because a tracing vendor had a bad minute. I still think about that one.
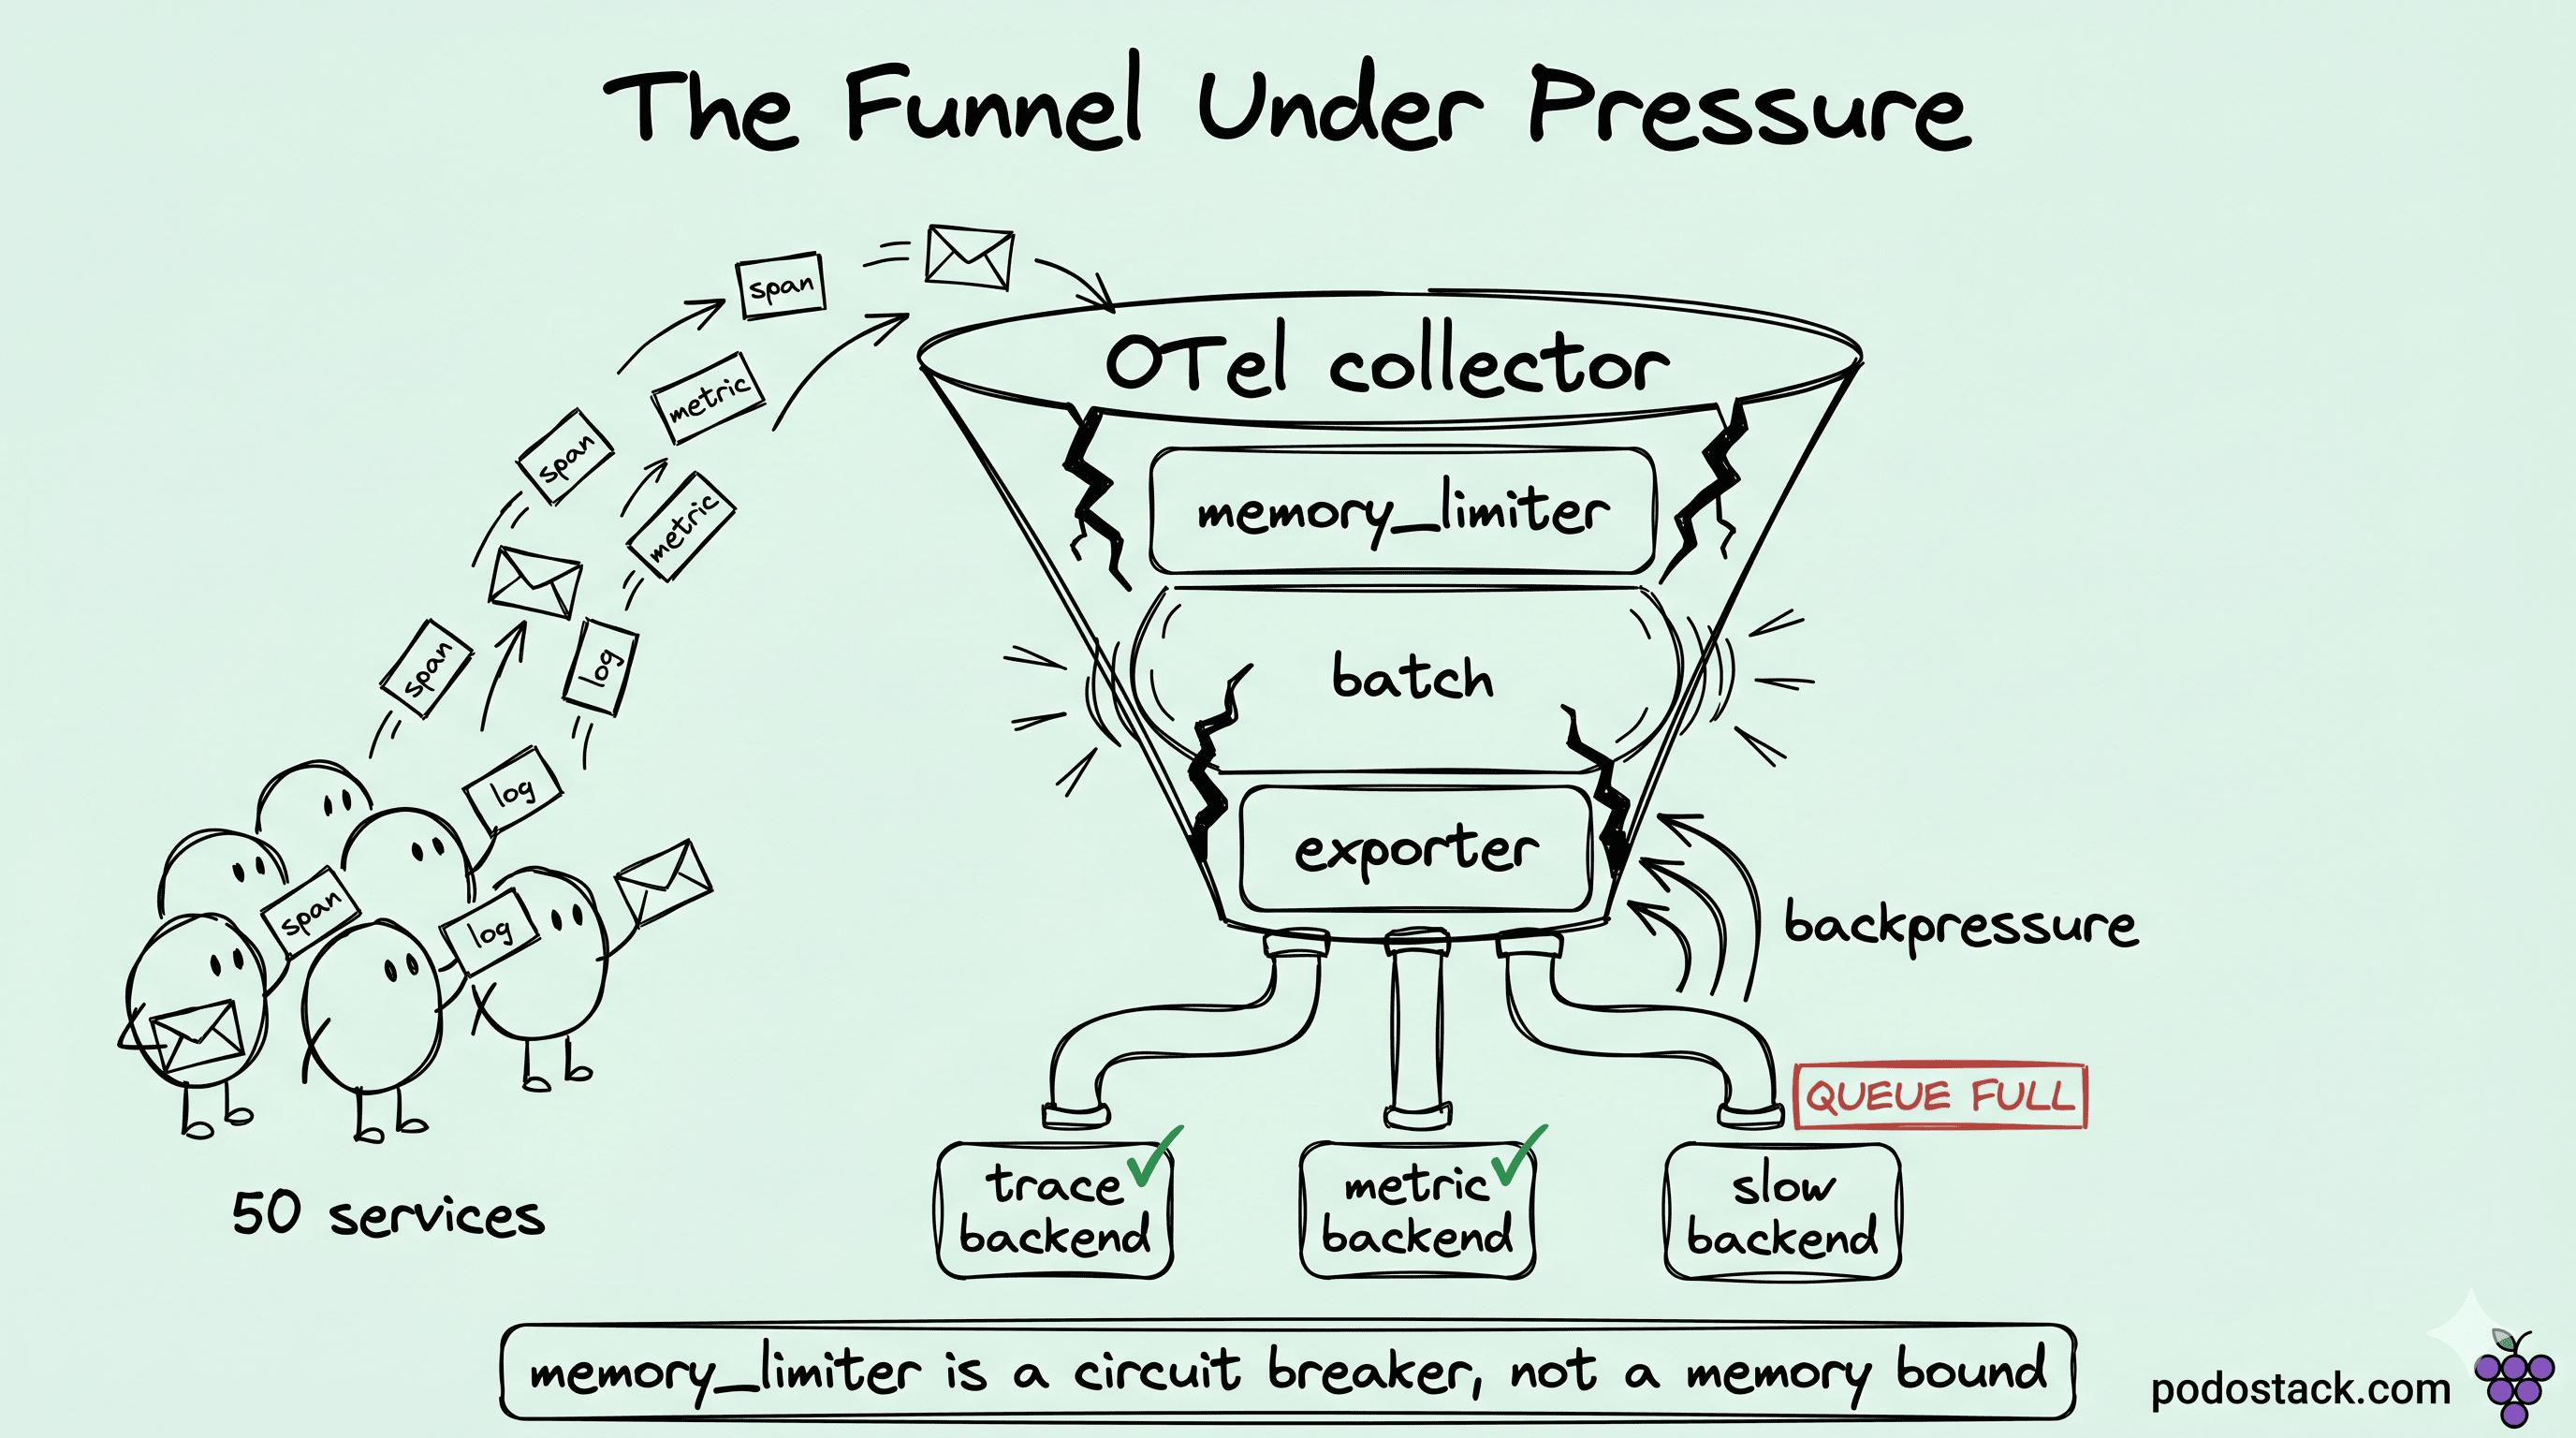
Memory was the part I got most wrong. The Go heap is shared across every pipeline in the process, so a spike in trace volume pushes out metric pipelines that were behaving fine. The limiter pushes back, but it does it by rejecting input at the receivers, not by isolating anything. When it says no, the receiver returns an error to the client, and that error is what the application sees as a dropped span. The limiter is a circuit breaker, not a memory bound - and I had been treating it as a bound for a year.
Here's the mechanism that bit us. The limiter checks heap on an interval, compares it against the soft limit plus the spike allowance, and refuses new data when it's over. Between checks, memory grows unobserved. Our interval was the default 1 second. Our batch processor could accumulate 200 MB of spans in about 800 milliseconds at peak. The limiter never caught it in time, the collector OOMed anyway, and the counters stayed green until the kill. The fix there was eventually to drop the interval to 250ms, but that came later.
Links
OpenTelemetry Collector: Configuration - how receivers, processors, and exporters compose into one pipeline per signal type.
OpenTelemetry Collector: Architecture - the data path through the collector and where the in-memory queues sit.
The one-line bug we'd shipped to production
The batch processor exists for a good reason - most backends would rather receive 100 spans in one request than 100 requests of one span each. It collects until a size or a timeout and then ships. The cost is memory, and an unbounded batch buffer is the single most common way a collector grows itself into an OOM. Ours wasn't unbounded, but the order was wrong, and the order is load-bearing.
This is what we'd written on day one, and it had survived three reviews:
processors:
  batch:
    send_batch_size: 8192
    timeout: 5s
  memory_limiter:
    check_interval: 1s
    limit_mib: 1500
    spike_limit_mib: 512

service:
  pipelines:
    traces:
      receivers: [otlp]
      processors: [batch, memory_limiter]
      exporters: [otlp]
The batch processor buffers spans before the limiter ever sees them. The collector OOMs while the limiter's gauge reads fine - which is exactly the symptom I'd spent twenty minutes blaming the network for. We swapped the order of two processors and redeployed:
service:
  pipelines:
    traces:
      receivers: [otlp]
      processors: [memory_limiter, batch]
      exporters: [otlp]
After that, the limiter caught the data at the front of the chain instead of behind the buffer. Heap crossed the soft-plus-spike line, the receiver started refusing, the batch buffer stopped growing because nothing fed it anymore, and we watched the nightly sawtooth flatten within an hour of the deploy. I've since seen this exact inversion in three other teams' configs, and it ships past review every time because both orders parse and both work fine at five services.
A word on what "drop" means here, because it cost us a day of confusion. When the limiter rejects, the receiver returns a RESOURCE_EXHAUSTED gRPC error to the client, and the OTel SDK is supposed to retry with backoff. Some SDKs do this well. Ours, on one polyglot service, did not, and we lost data silently while the dashboards looked merely thin. If your tracing backend shows a sudden cliff at peak, check the receiver's refused-spans counter before you blame the network, which is the advice I wish someone had given me at 4 AM.
Links
OpenTelemetry Collector: batch processor - send_batch_size, timeout, and the memory cost that makes ordering matter.
OpenTelemetry Collector: OTLP receiver - what the receiver returns to clients when the limiter refuses data.
Rebuilding it as a gateway
Reordering processors stopped the nightly OOM, but one replica was still one replica, and tail-based sampling didn't work at all because no single instance saw a whole trace. So we rebuilt the topology. There are three patterns that show up in real deployments, and we'd been sitting on the one that doesn't scale.
The first is agent-only - one collector per node as a DaemonSet, applications send to localhost, and it batches and ships. This is the simplest model and it genuinely works well at small scale, say under 30 services and 500K spans per minute per node. We'd outgrown it without noticing. Its failure mode is that every agent talks to every backend, so you get N agents times M backends of connections, and some backends hate that. Tail sampling also can't work here, because no single collector sees the full trace.
The second is a gateway tier, which is where we landed. Agents on each node forward to a central pool, fronted by a load-balancing exporter that routes by trace ID so the same gateway instance sees every span of a trace. That last part is the whole reason tail sampling works:
exporters:
  loadbalancing:
    routing_key: traceID
    protocol:
      otlp:
        tls:
          insecure: true
    resolver:
      dns:
        hostname: otel-gateway.observability.svc.cluster.local
        port: 4317
The agents stay light, the gateway scales horizontally, and we paid for it with one more network hop and one more thing to run. The third pattern is a hybrid - agents do the cheap local work, batching and resource detection, while the gateway handles sampling and fan-out and anything needing a full trace view. Most setups past a few hundred services drift here, and we expect to as well.
Picking between them came down to two questions for us: did we need tail sampling, and how many backends were we fanning out to. We needed sampling and we had three backends, so the gateway was the obvious move. If you have one backend and make no full-trace decisions, agent-only is genuinely fine and the gateway is just overhead you'll resent operating.
Links
OpenTelemetry Collector: Deployment patterns - agent, gateway, and the hybrid in between.
OpenTelemetry Collector: Scaling - how to size the gateway pool to your span rate.
loadbalancing exporter - routing by trace ID so one instance sees every span of a trace.
tail sampling processor - why the sampling decision needs the whole trace.
What we watch now
The collector ran clean for the next quarter, and the changes that bought us that were boring. We pinned the limiter first and batch second in every pipeline. We split traces, metrics, and logs into separate pipelines so a slow logs backend can never again take out tracing the way it did that Tuesday. We gave every exporter a sending queue and exponential backoff, because the default queue is small and a 30-second backend hiccup used to mean we dropped spans until someone restarted the pod. And we sized the gateway pool to span rate - we started at roughly one pod per 20K sustained spans per second and then load-tested, because the collector behaves nothing alike at 10K and 100K spans per second and synthetic load is cheaper than learning that at 4 AM.
We also started scraping the collector's own telemetry, which I wish we'd done a year earlier. It exports its internal metrics through the obsreport hooks, and running it blind for that long is how the OOM crept up on us in the first place. We alert on the refused-spans counter and the exporter queue depth now, the same way we watch any other production service. The Prometheus WAL evergreen goes deeper on the same idea, an observability component that itself needs observing.
I went back through that month of dashboards afterward, and what got me was how quiet all of it had been. The memory pressure had built for weeks without tripping one alert, and the drops only ever reached us as thin graphs instead of pages. Every fix we shipped that quarter turned out to be a reordered processor or a split pipeline, never the extra replica I'd kept reaching for at 4 AM - the same config had run fine at five services and fallen over at fifty. The collector hasn't paged me since.
Links
OpenTelemetry Collector: Internal telemetry - the obsreport metrics to scrape and which ones to alert on.
OpenTelemetry Collector: exporter queue and retry - sending_queue and retry_on_failure, and why the default queue is small.
I pulled the same thread on the Prometheus side in two earlier pieces - the WAL one on silent disk growth, and the cardinality one on the bill. Same failure shape, different component.