
Prometheus WAL: the silent disk growth nobody diagnoses correctly
Write-ahead log internals, checkpointing, replay, and how cardinality becomes a disk problem

You don't think about the write-ahead log until the day your Prometheus takes 22 minutes to start after an OOM kill, or you notice your data/wal directory is 40 GB on a cluster that scrapes "maybe a couple thousand targets", or a dashboard query returns nothing for the last two hours and the only log line is corruption detected. Each of those is a WAL problem with a very specific cause you can diagnose once you know what the thing actually is.
Prometheus buffers new samples in memory (the Head Block) and simultaneously appends them to a journal on disk (the WAL). The in-memory copy is fast to query. The on-disk copy is durable. Between them, they answer "what happens if the process dies" without asking you to run a cluster of synchronously-replicated databases just to collect metrics. The tradeoff is that the journal is now an operational surface with its own failure modes.
Here's the full story.
What the WAL actually contains
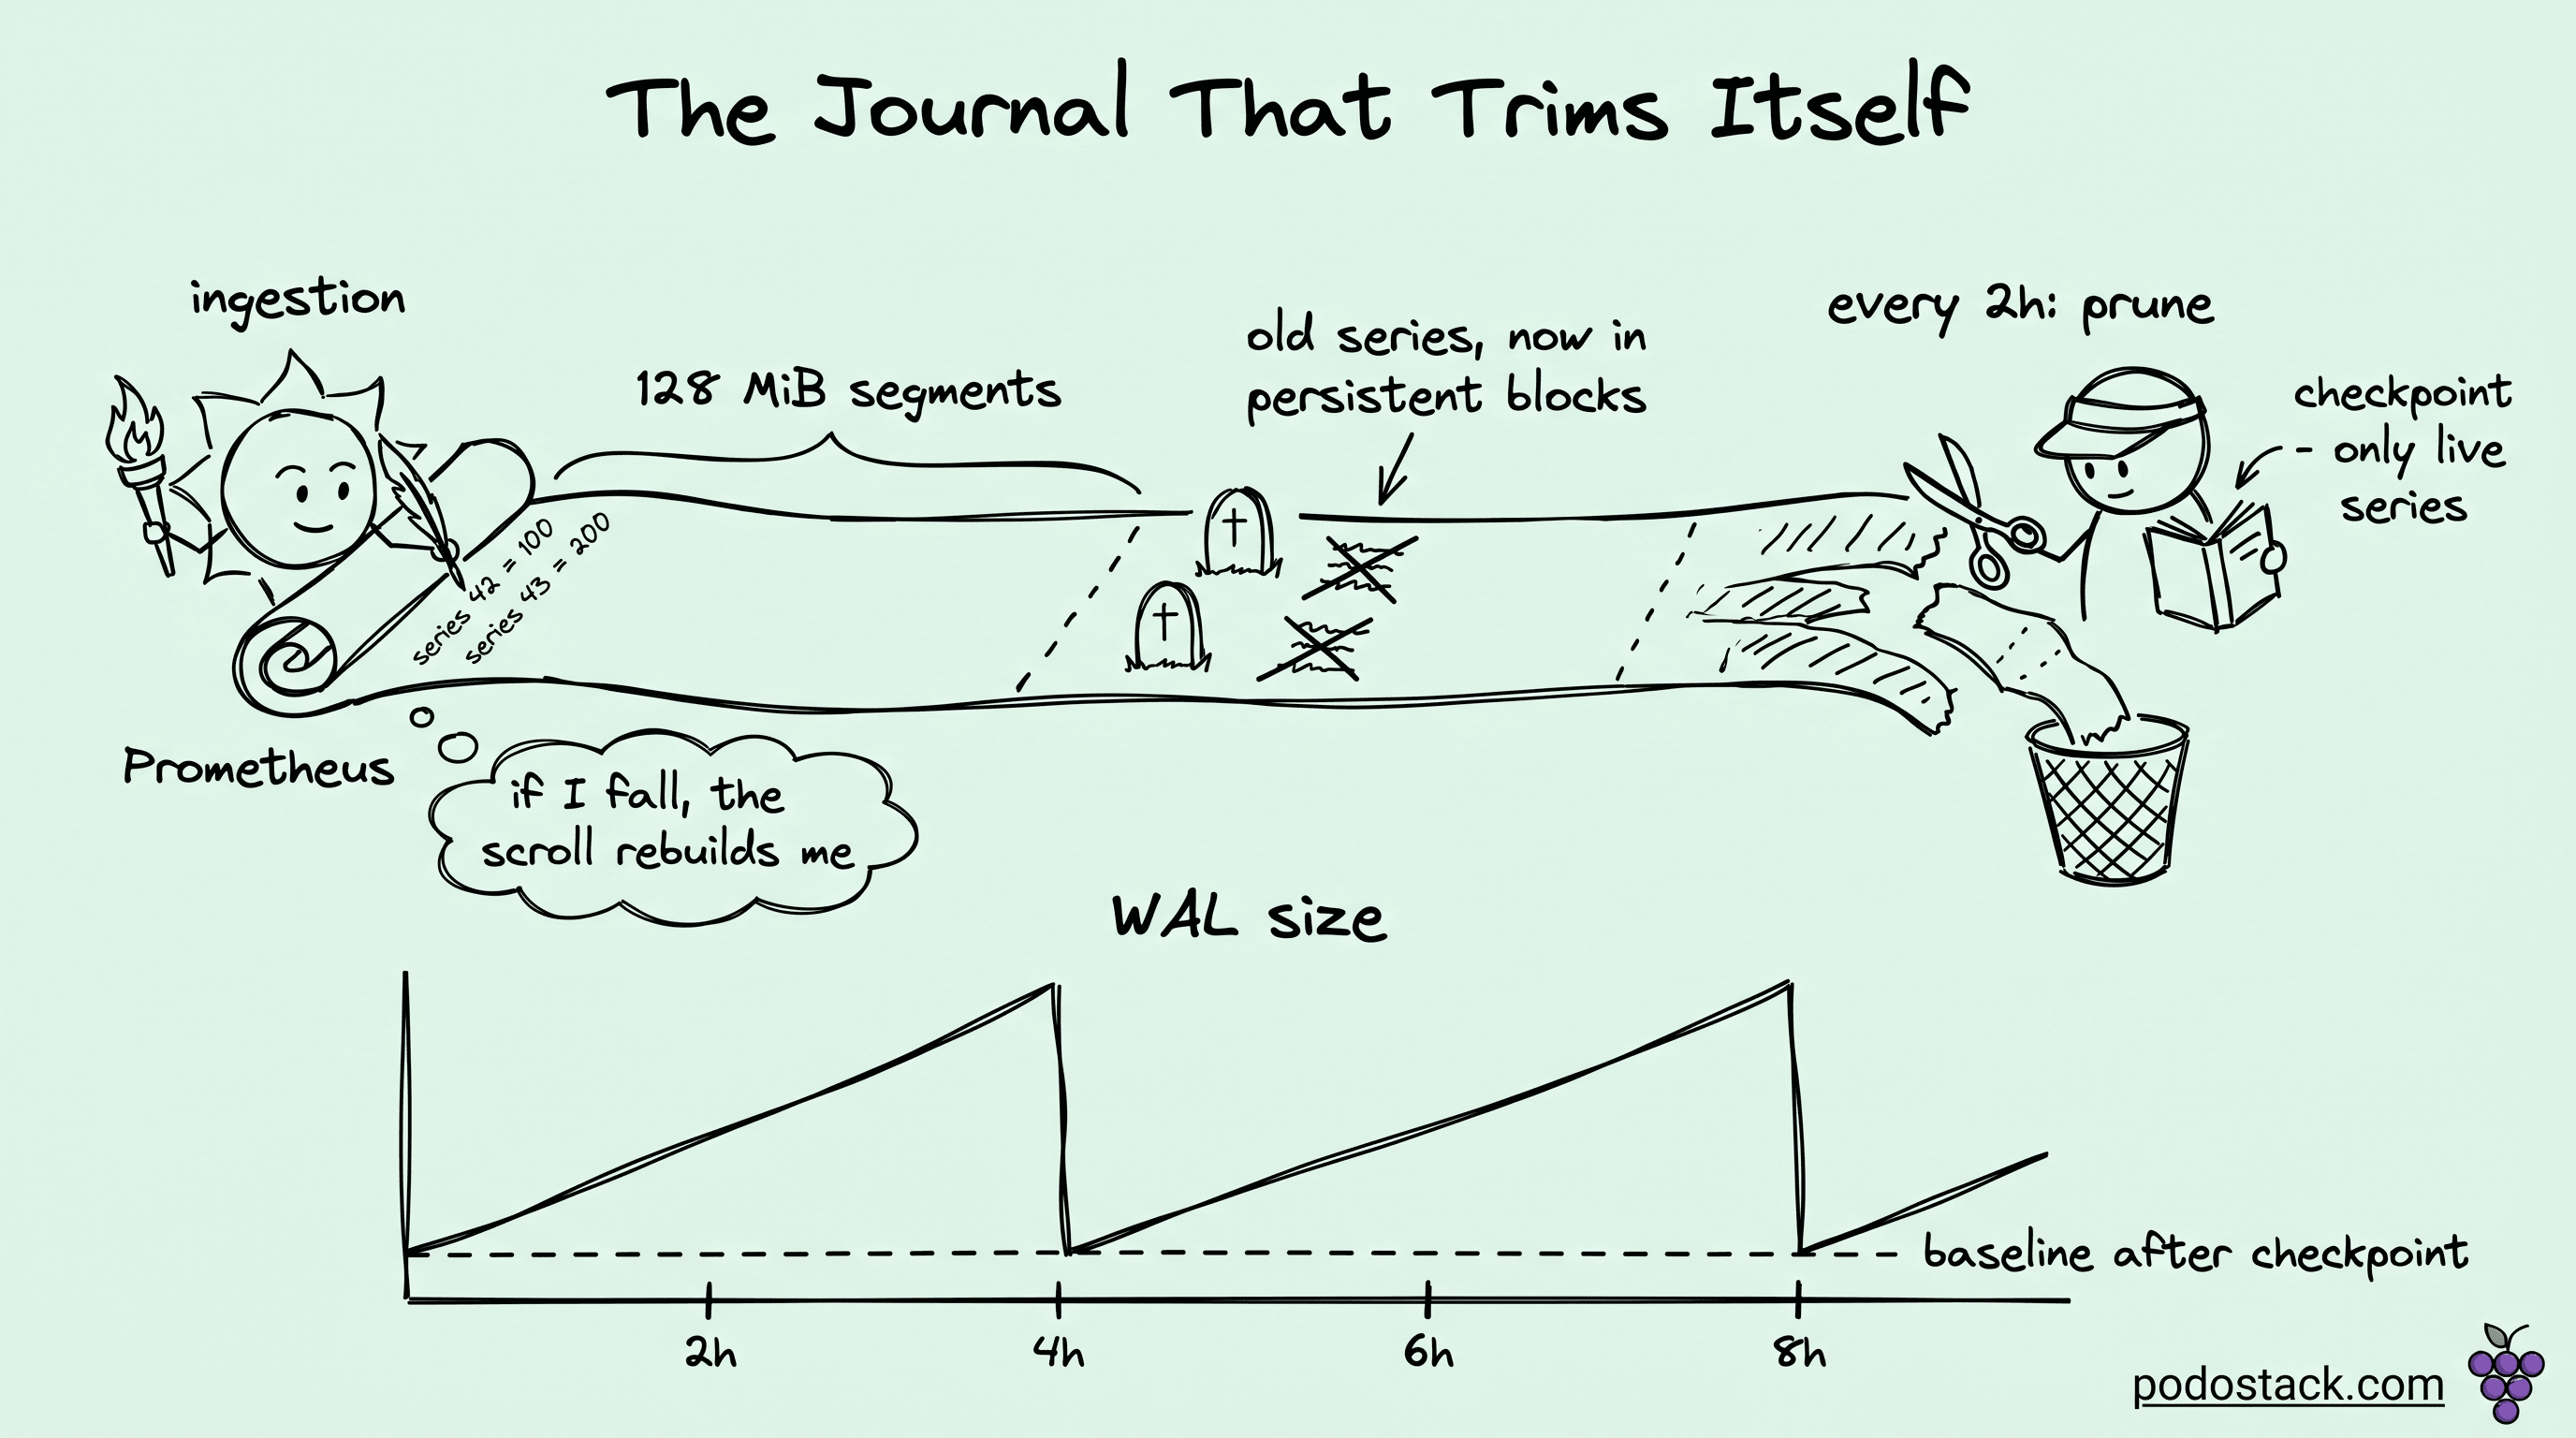
The WAL lives at data/wal/ inside your TSDB data directory. Inside, you'll find sequentially numbered files like 000002, 000003, 000004. Each segment is capped at 128 MiB. That size is hardcoded, you can't tune it with a flag.
Inside each segment, three kinds of records:
Raw samples: a timestamp plus a value, tagged with a series reference.
Series descriptors: the label sets for each new time series, with a monotonic ID.
Tombstones: markers for deleted data, created when you call the delete API.
The WAL only holds the active Head Block's data, which is typically the last 2 to 3 hours of scrapes. Once Prometheus compacts older samples into a persistent block, those samples get purged from the WAL. What remains in the WAL is whatever the running Head Block still needs. The journal is a window, not an archive.
Links
Ingestion through the WAL: the write path
When a scrape completes, each new sample goes through three phases. First, the sample gets appended to the current active WAL segment on disk. Second, it gets inserted into the in-memory Head Block so queries can see it immediately. Third, when the active segment crosses 128 MiB, Prometheus creates a new segment and starts writing there.
The order matters. If the process crashes between the WAL append and the Head insert, the next startup will replay the WAL and rebuild the Head. If the crash happens before the WAL append completes, that sample is simply lost, which is the expected tradeoff for a metrics system as opposed to a bank ledger.
Rotation is continuous. A busy Prometheus scraping thousands of targets rotates segments every few minutes. A quiet one might keep the same segment for an hour.
Checkpointing: the mechanism that makes WAL bounded
This is the part most engineers never look at, and it's where the real magic is.
Every two hours (by default, driven by min_block_duration), the Head Block truncates. The oldest samples compact into a persistent block on disk, and the Head now covers a shorter time window. But the WAL still contains records for samples that are now in the persistent block, plus records for series that no longer have any samples in the Head.
To clean this up, Prometheus writes a checkpoint. A checkpoint is essentially a filtered WAL, containing only the records that are still relevant to the active Head:
Series descriptors for series that still have active samples.
Raw samples within the current Head window.
Tombstones that haven't been fully applied yet.
After the checkpoint finishes, Prometheus deletes the old WAL segments. The WAL size drops. The next replay after a crash will read the checkpoint plus any WAL segments written after it.
This is why WAL size is bursty. A healthy Prometheus sawtooths: grows linearly between compactions, drops at each compaction boundary. If you watch data/wal/ over time and see the sawtooth, you're fine. If you see monotonic growth with no drops, something is wrong. Usually the something is cardinality.
Cardinality as a WAL problem, not a memory problem
Most writeups about cardinality focus on RAM. Prometheus running out of memory, query OOMs, slow lookups. That's all true. The less-discussed side is that every new series gets a new series descriptor record in the WAL, and every scrape of every series appends another sample record.
If your services legitimately expose 50 series each and you have 200 services, your WAL grows at a rate determined by 10,000 series times your scrape interval. Predictable and manageable.
If your services expose 50 base series but those series carry a pod_template_hash label and you deploy four times a day, you're actually generating new series every deployment. Each deployment means 10,000 new series descriptor records in the WAL, and then the old 10,000 series keep getting samples until the Head drops them.
"High churn" is the Prometheus jargon for this. Labels that change frequently. Kubernetes pods with hashed names. Kafka consumer groups with generation IDs. Job labels that include the CI build ID. Each of these quietly inflates the WAL because every unique label combination creates a new series, and the series descriptor has to live in the WAL until the checkpoint catches up.
Diagnose churn with one PromQL query:
rate(prometheus_tsdb_head_series_created_total[1h])Divide by the rate of deletion. If creation runs an order of magnitude faster than deletion, you have churn. The WAL is telling you.
Links
Why your Prometheus took 22 minutes to start
When Prometheus boots, it doesn't trust that memory is correct. The Head Block starts empty. To rebuild it, Prometheus reads the most recent checkpoint, then reads every WAL segment written after that checkpoint, replaying the records in order.
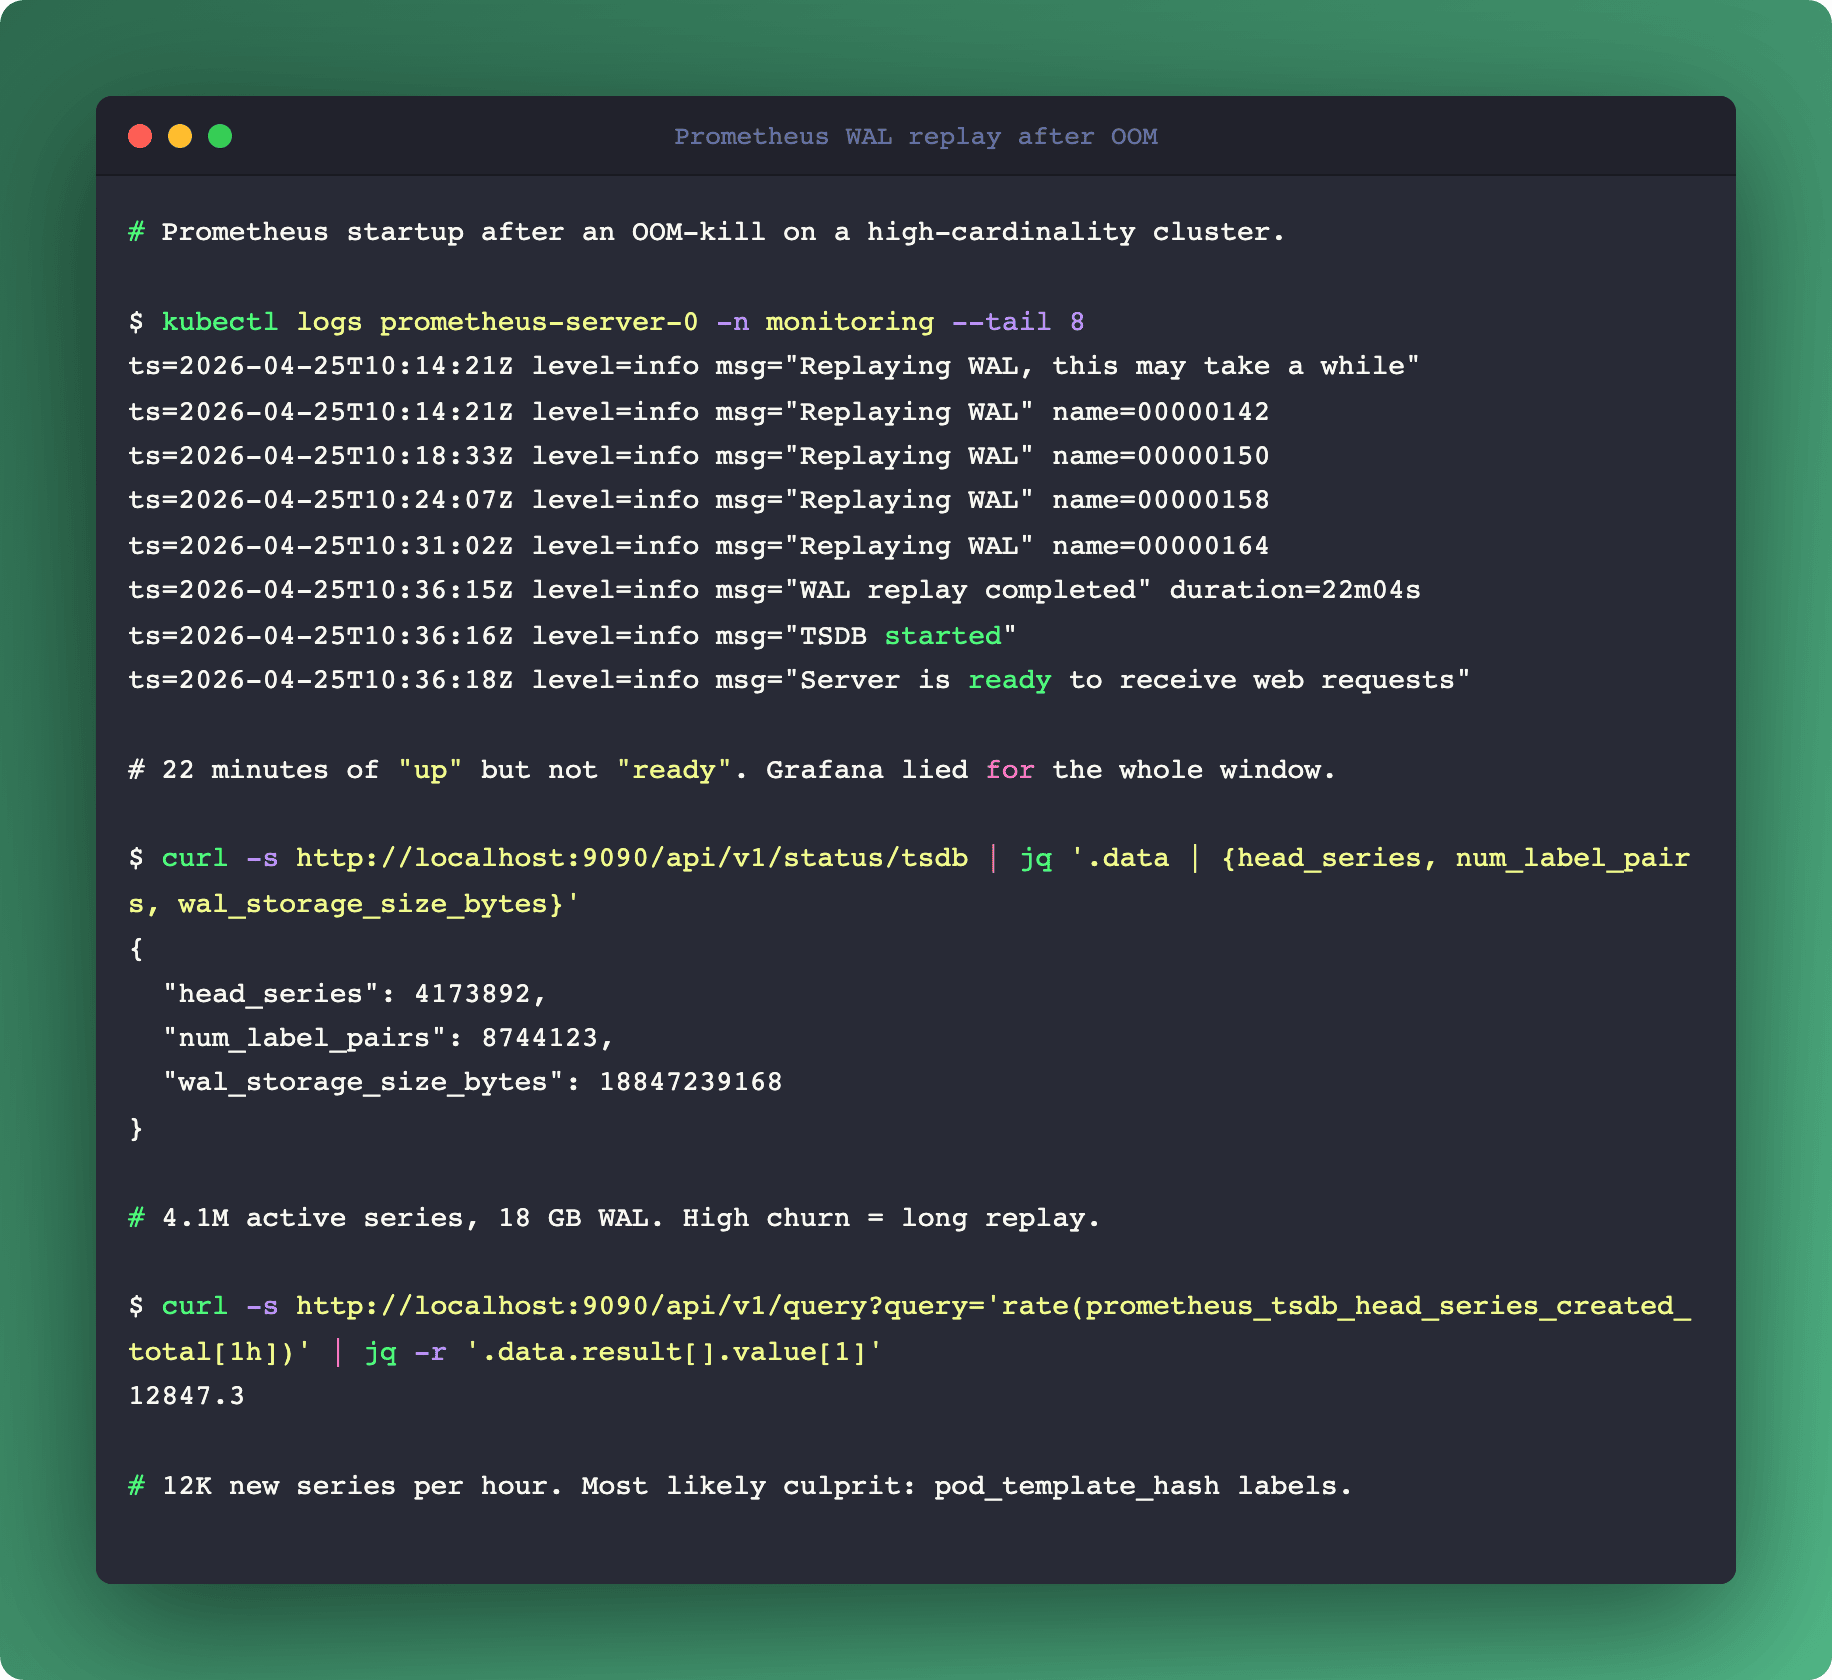
The time this takes is linear in the size of the WAL. A 1 GB WAL replays in maybe 30 seconds on a reasonable disk. A 20 GB WAL (which happens in churn-heavy clusters) can take 20 minutes. Your Prometheus is up but not ingesting until the replay completes. Grafana dashboards dependent on that Prometheus are lying to you the entire time.
Two mitigations, in order of reach:
Enable WAL compression. The flag is
--storage.tsdb.wal-compression, on by default since Prometheus 2.20. If you're running an older version, turn it on explicitly. Snappy-compressed WAL reads faster because there's less disk to read. Typical 2-3x size reduction.Reduce cardinality. Everything in the previous section. Drop the
pod_template_hashlabel, use service-level aggregation, metric_relabel_configs to blacklist high-cardinality labels at scrape time. This is the structural fix.
There's a third mitigation that's an escape hatch, not a solution: delete the WAL directory. Your last 2-3 hours of data go away but Prometheus starts clean. Do this only when the alternative is hours of unavailability and you're willing to accept the data loss.
Links
WAL corruption: what actually happens
Disk failures, filesystem issues, or interrupted writes during a crash can produce a corrupted WAL segment. Startup fails with corruption detected at record N in segment 00000X.
Since Prometheus 2.10 or so, recovery is mostly automatic. Prometheus skips the corrupt record, logs a warning, and continues replay from the next valid record. You lose whatever samples were in the bad record, typically a few seconds of data for a subset of series.
The remaining manual cases:
Prometheus crashes during replay, unable to skip. Delete the bad segment manually (find it by log line), restart. You lose that segment's samples but keep the rest.
A checkpoint is corrupt. Delete the checkpoint file and let Prometheus recompute from the preceding WAL segments.
Everything is corrupt. Delete
data/wal/entirely. Keep your persistent blocks indata/untouched. You lose the last Head window (2-3 hours), historical data is intact.
The right default is to treat the WAL as recoverable but ephemeral. Never manually edit it. Never try to recover specific records. Either you trust Prometheus to skip and move on, or you wipe and accept the loss.
Disk layout that actually matters
If you're sizing storage, the WAL and the persistent blocks live under the same data/ directory. They grow differently:
WAL: bursty, sawtooth, bounded by Head Block window times churn rate. Rarely over 10 GB on a well-tuned instance.
Persistent blocks: monotonic in retention window times ingestion rate. Can be hundreds of GB or TBs.
If you run Prometheus on a single filesystem, the WAL can sometimes fill the disk before the persistent blocks notice. The symptom is write error: disk full in the logs and all scrapes failing simultaneously. The fix is either to put data/wal/ on a separate volume with its own capacity guarantee, or to monitor free space on the shared volume with an alert well below full.
The three signals to actually alert on
Most Prometheus monitoring setups alert on up{job="prometheus"} == 0. That's fine but it's a lagging signal. Three leading signals that catch WAL issues before they become outages:
prometheus_tsdb_wal_corruptions_total: any non-zero rate means disk or filesystem trouble. Page on a rate greater than zero.prometheus_tsdb_head_series: plot over time. A linear climb without drops means your checkpoints are not catching up, cardinality is probably exploding. Warn if growth is 2x over 24h.prometheus_tsdb_head_max_time-prometheus_tsdb_head_min_time: the Head window. Should be roughlymin_block_duration. If it drifts wider, compaction is falling behind. Warn if it exceeds 3 hours.
These three capture the main operational failure modes: corruption, cardinality explosion, and compaction lag. None of them are in the default dashboards shipped with kube-prometheus-stack, so you have to add them yourself.
Links
Summary
The WAL isn't complicated once you see the mechanics. A bounded journal, checkpointed every two hours, replayed on startup. The failure modes are all downstream of one root cause: your metric shape. Low cardinality plus compression plus one filesystem with headroom is a WAL that takes care of itself. High churn plus no compression plus a shared volume is a WAL that will wake you up on a weekend.
If you only walk away with one operational change, it's this: turn on WAL compression, alert on prometheus_tsdb_wal_corruptions_total, and put a cardinality SLO in your FinOps conversation. The WAL will stop being interesting, which is what you want.
More on observability cost math in our Prometheus Cardinality FinOps deep dive. For the eBPF-based alternative that measures per-workload resource pressure directly, see eBPF Beyond Networking.