

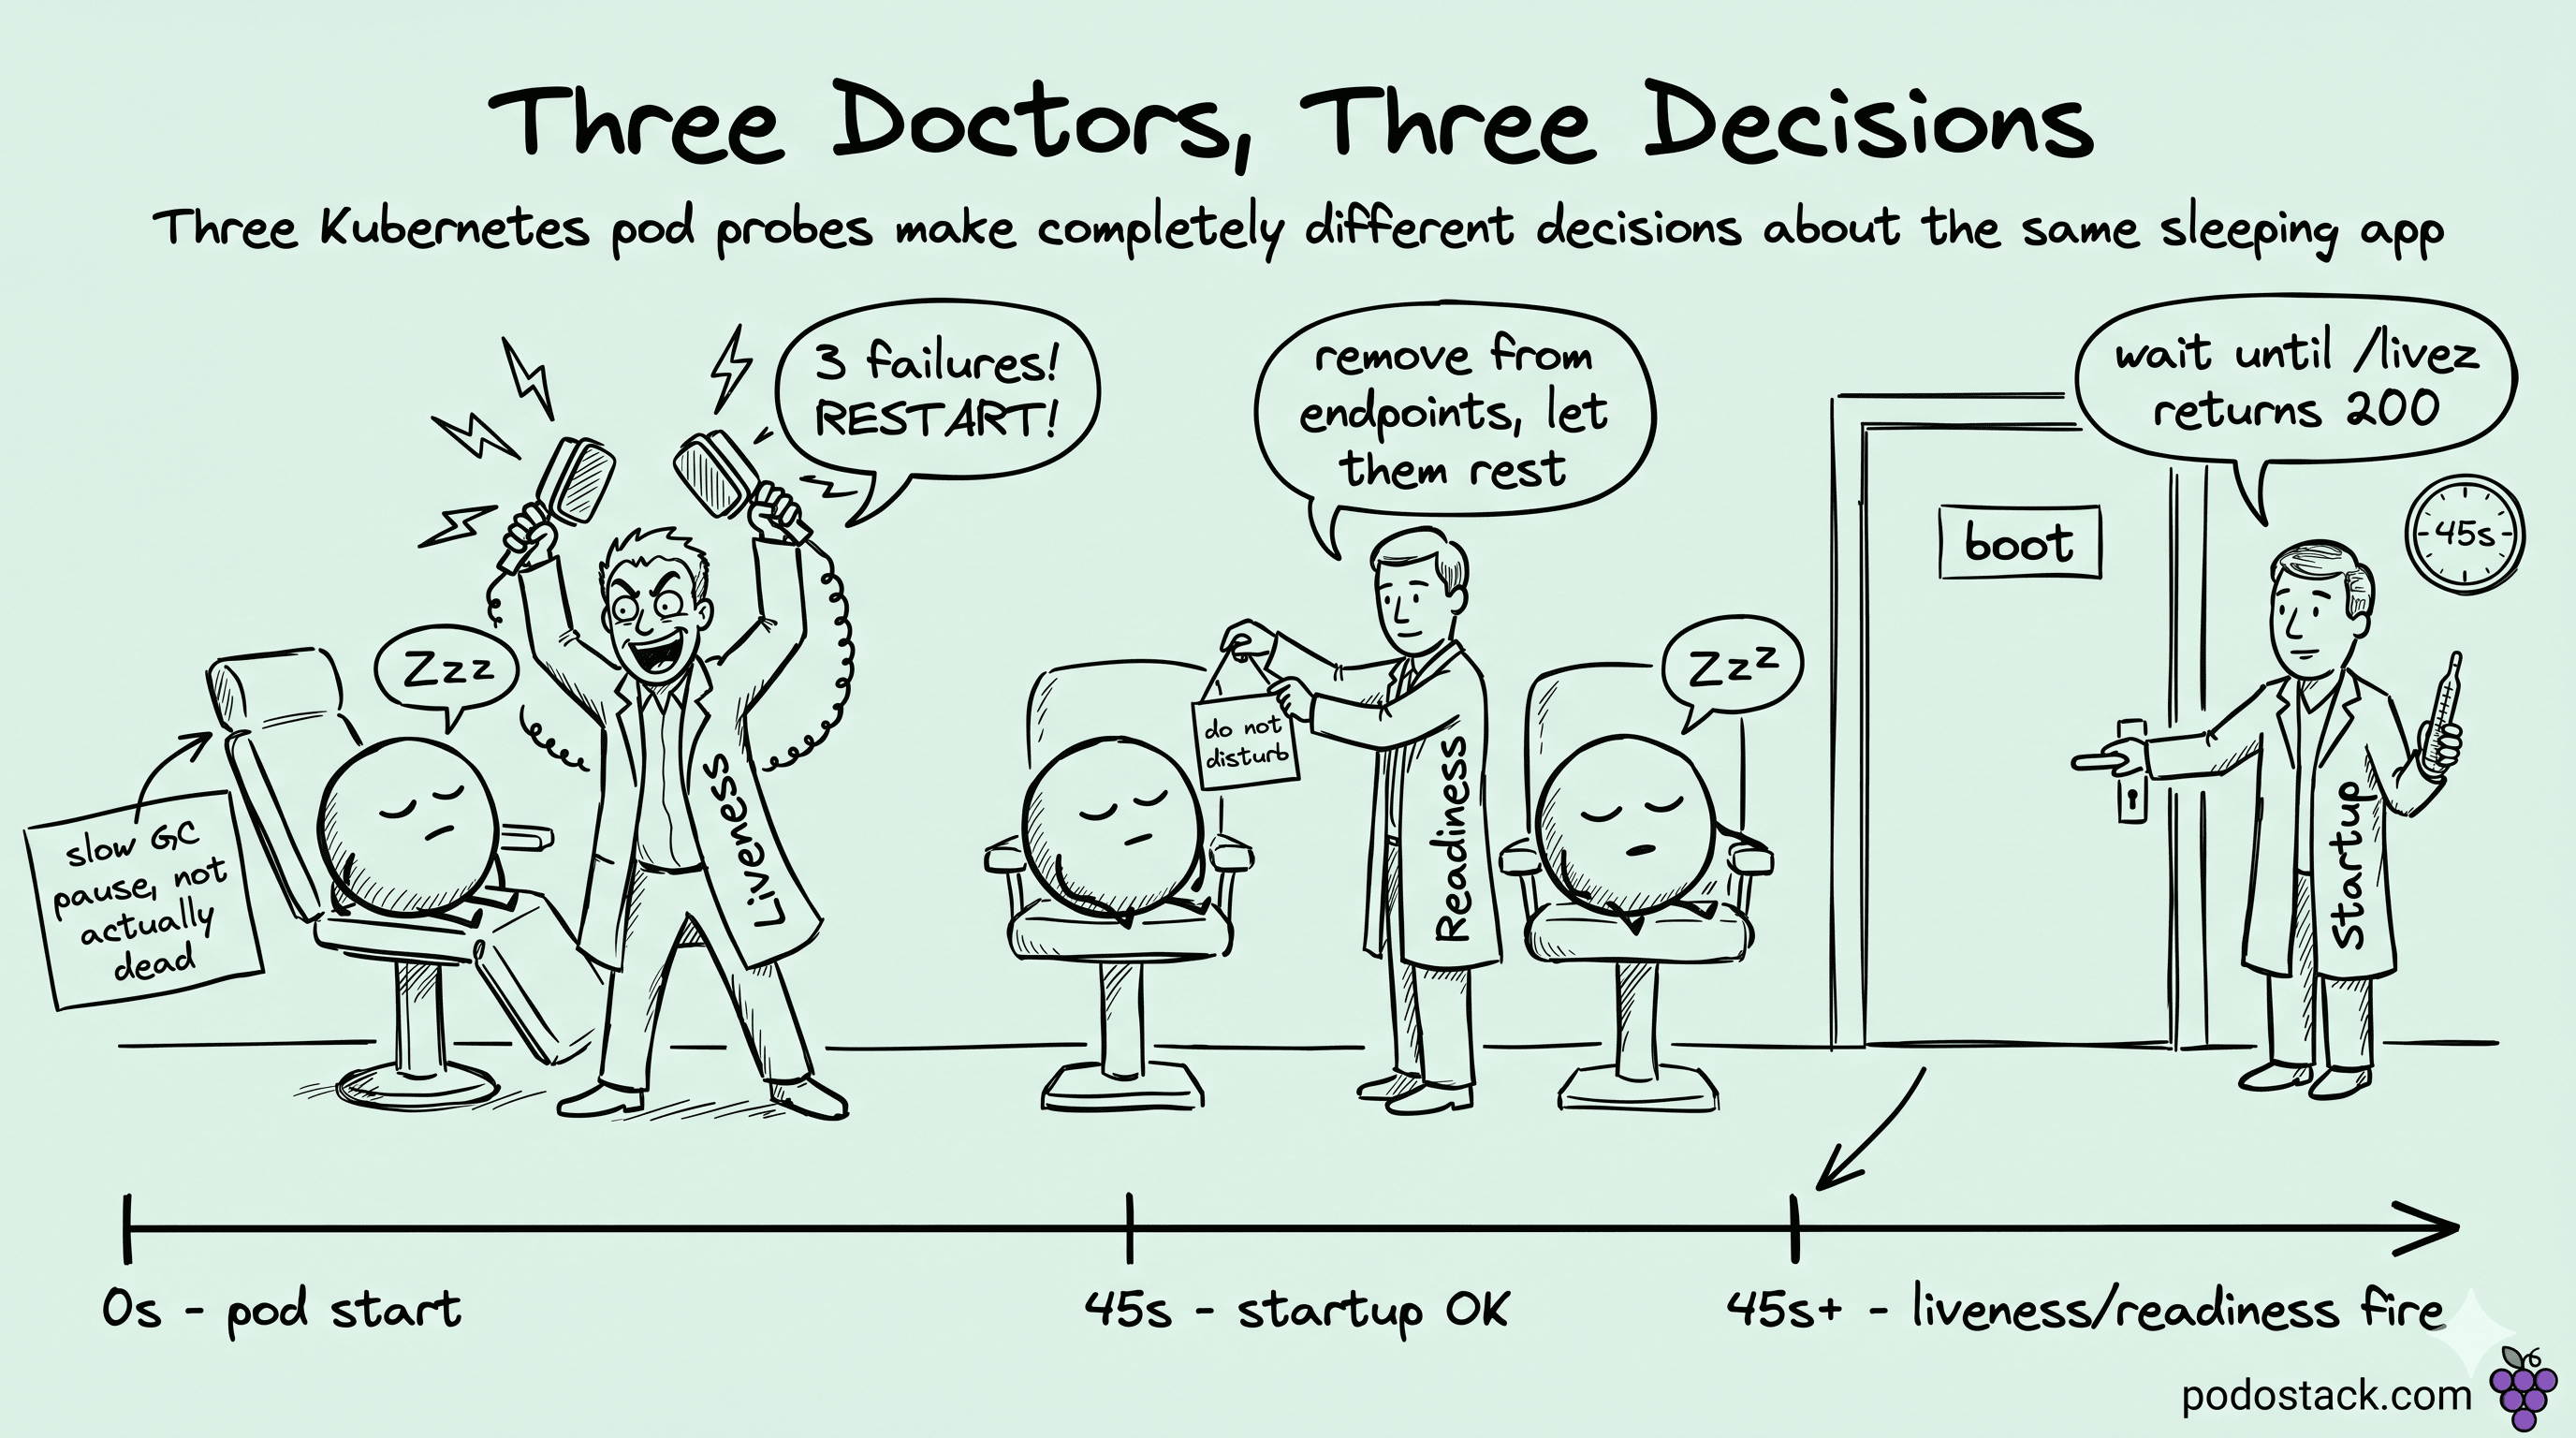
The pod with restart count 47 was running fine. It was a payment-edge service we'd been on call for since the rewrite, and the dashboards said latency was healthy, error rate was at the usual weekday floor, throughput was on the seasonal curve.
The only thing wrong with the pod was the kubelet's view of it: by Wednesday lunch the kubelet had killed and restarted that pod 47 times in three days, and we'd missed every single restart because the next pod was up in eleven seconds and our alerts were tuned to "down for >60s" because of an unrelated noise problem the year before.
That number is why I now spend more time on probe configs than on any other YAML in our clusters. The pod was not broken. The liveness probe was. (Issue #15 covered the first 60 seconds of a pod's life; the W1 Friday evergreen covered the last 30. This is the liveness loop that runs in between.)
The first time we caught it
We caught the GC-pause version first, on the JVM payment service. The events on kubectl describe pod after the 47th restart came back with the line we'd seen a hundred times and never read closely:
Events:
  Type     Reason     Age                  From     Message
  ----     ------     ----                 ----     -------
  Warning  Unhealthy  2m (x14 over 5m)     kubelet  Liveness probe failed:
    Get "http://10.0.2.7:8080/healthz": context deadline exceeded
  Normal   Killing    2m                   kubelet  Container app failed
    liveness probe, will be restarted
context deadline exceeded means the probe timed out before the app answered - not that the app was dead, just that it didn't say "I'm here" inside one second. Our config was the one our Helm chart had been shipping since 2022:
livenessProbe:
  httpGet:
    path: /healthz
    port: 8080
  periodSeconds: 10
  timeoutSeconds: 1
  failureThreshold: 3
That's a thirty-second budget before the kubelet acts: three consecutive failures, ten seconds apart, one-second timeout each. Thirty seconds sounds generous, and we'd thought of it as generous for years. It isn't, when worst-case GC on the JVM in question is a two-or-three-second stop-the-world.
The G1 collector that Wednesday was doing a mixed collection on a heap that had been growing toward its target since the previous deploy. Two pauses landed inside the same thirty-second window, three probes timed out in a row, kubelet sent SIGTERM, pod restarted, the new pod's heap immediately started growing toward the same target, and the same GC pattern lined up against the same probe schedule a few hours later. Forty-seven times across three days.
What we were throwing away each time was a process with a warm JIT-compiled hot path - the replacement was always going to GC worse than the one we'd just killed.
The fix that day was two lines: timeoutSeconds: 5, periodSeconds: 15. The deeper fix took a quarter and a different incident before we got around to it.
The second time was worse - it killed the deployment
The second incident hit a Postgres-backed checkout service. Someone had added a SELECT 1 to the /healthz handler during a different incident the year before - a "connection check" that nobody had revisited. Postgres started a routine autovacuum on a 200GB table, query latency climbed to four seconds, every /healthz request waited four seconds, every probe timed out, every pod in a thirty-pod deployment failed liveness inside the same thirty-second window.
The kubelet has no coordination between nodes. Each kubelet, on its own pod, independently decided that liveness had failed three times and the container had to restart. Inside about a minute the entire deployment was being restarted in parallel. What came back online was thirty cold processes reconnecting to a Postgres that was already under vacuum pressure, which extended the incident by another six minutes after we'd figured out the trigger.
The fix was four lines: drop the Postgres check from /healthz entirely, move it to a separate /ready endpoint that the readiness probe (not the liveness probe) was already pointing at. Readiness failing doesn't restart anything - it just pulls the pod's IP out of Service endpoints for as long as the check is failing. A pod whose readiness is red for ninety seconds and then recovers is, from the kubelet's perspective, fine - the container was never touched.
That distinction - readiness pulls traffic, liveness restarts - is something I'd been able to recite for years before I learned what it actually meant in production.
What we'd been telling the kubelet to do all along
After the second incident we sat down and traced what each probe was actually doing on the kubelet's side. Three probes in the API, all configured the same way in YAML, all of which we'd been treating as interchangeable health checks. They are not.
What we'd missed in our mental model was that a failed liveness probe goes through the container's full shutdown contract. The kubelet runs the preStop hook if there is one, sends SIGTERM, waits up to terminationGracePeriodSeconds, then SIGKILL. Restart count goes up by one. The pod stays on the same node and the same volumes.
If liveness keeps failing for the same reason, the kubelet keeps restarting - there's no exponential backoff for "this pod is in a probe-induced loop", just the regular crash-loop backoff after the kubelet has tried a few times. We'd been imagining the kubelet as smarter about probe loops than it actually is.
Readiness has nothing to do with the container at all, which is the part I had wrong for years. When readiness fails, the endpoint controller (the one that maintains EndpointSlice objects behind Services) removes the pod's IP from the slice. Traffic stops being routed to it. The container itself is not touched - no SIGTERM, no restart, no event in the pod's history.
When readiness succeeds again, the IP goes back in. A pod in our cluster can flap ready/not-ready for hours and kubectl get pods will keep saying it's Running, because it is.
Startup is the one we'd never set on any of our services until after the third incident, which I'll get to in a minute. While startup is running, the kubelet polls it on its own schedule and ignores liveness and readiness completely. The first time startup returns 200, the kubelet stops polling it forever, marks startup as done, and the other two probes take over.
If startup never succeeds within its budget (failureThreshold × periodSeconds), the container restarts. It's the kubelet's way of saying "this app boots slowly and that's allowed, but it doesn't get to boot forever".
The thing that surprised me when I finally read it carefully was that there's no built-in "is this app healthy" probe. Liveness is "does the process respond to a probe at all". Readiness is "should we route traffic to it right now". Neither answers the question most teams think they're asking, which is "is the app fine".
Links
The third incident we never had: slow boots
The third one we caught before it shipped. We were rolling out a new Spring Boot service whose schema migrations on startup were taking close to four minutes when the database was busy. Default liveness probe, no startup probe, initialDelaySeconds: 60 because that's what the Helm chart shipped.
The pod would come up, fail liveness inside the first thirty seconds of running (because the app wasn't answering yet), the kubelet would restart it, and the new pod would also fail in the same window. Restart loop before the first deploy was even fully rolled out.
Before startup probes existed (added in 1.16), the answer was to keep cranking initialDelaySeconds higher. The shape of the problem is that boot time isn't a constant - it depends on what the node has cached, whether the image was already pulled, how busy the database is, whether JIT warmup has happened yet, whether sidecars are ready. Pick a number too low and you restart-loop on slow days. Pick a number too high and every deploy wastes the difference.
Startup probes are the proper fix. Here's what we shipped that day:
startupProbe:
  httpGet:
    path: /healthz
    port: 8080
  periodSeconds: 5
  failureThreshold: 60
livenessProbe:
  httpGet:
    path: /healthz
    port: 8080
  periodSeconds: 10
  failureThreshold: 3
The startup probe gets a five-minute budget (60 polls × 5 seconds) of slow polling. The moment /healthz returns 200 once, startup is done and liveness takes over with its tighter thirty-second budget. A pod that boots in 20 seconds isn't waiting an extra 40 for initialDelaySeconds to expire; a pod that boots in 250 seconds doesn't get killed mid-migration.
Startup and liveness point at the same endpoint on purpose - two endpoints means two diverging definitions of "alive" after the next refactor, and the divergence will not be caught in code review.
That config has been our default on JVM services ever since. The non-JVM ones get a shorter startup budget tuned to whatever the actual cold-boot p99 is.
Links
When we tried exec and went back to httpGet
We used exec probes on the Redis-backed services for about two years. redis-cli ping inside the container as the readiness check, on a 5-second period, because the Redis client we were using didn't expose connection state in a way HTTP could query cheaply.
It worked fine until we landed on a node packing 90 pods of various kinds, where the kubelet's fork-exec cost from probe churn became visible in node CPU graphs - not the dominant cost, but a measurable few percent that hadn't been there before.
We switched to an in-process Redis health endpoint exposed over HTTP, with the probe doing a regular httpGet. CPU on the busy nodes dropped by about a third, which is more than the probe arithmetic alone would have predicted (the cliff was sharper than the slope of incremental pods, because at some point the kernel runs out of headroom and every fork pays for it).
We've kept exec only for the small set of cases where the check has to read something inside the container's filesystem that the app itself doesn't expose - a flag file, a CLI tool that already shipped in the image and exits 0 when healthy.
The tcpSocket handler is the one we use the least. It opens a TCP connection and closes it - if the listener accepts, the probe passes. Cheap and uninformative: I've seen a process deadlocked in a CPU-burning loop while the kernel cheerfully held the listening socket open and tcpSocket happily passed.
We use tcpSocket only on startup probes for things that don't speak HTTP yet at boot (a worker that needs to come up on its TCP port before it begins doing useful work), and even there I push the team to add a real httpGet for liveness and readiness as soon as the HTTP layer is up.
Links
The order we run when someone hands us a restart loop
A new team brings us a pod that's restart-looping, the order goes the same way every time. We start at kubectl describe pod <name> and read the Events section at the bottom - the kubelet leaves a Warning event for every probe failure with the actual response or error attached, which is the difference between guessing and not guessing.
What's in that message is most of the answer. The one we've seen most often by far is context deadline exceeded, where the probe got out to the pod but the handler didn't answer inside timeoutSeconds - almost always a slow handler under load (often the same /healthz doing too much), not an actually dead process. In the last quarter we hit this five times: three turned out to be Postgres queries hiding inside health endpoints, the other two were JVM GC spikes during peak.
The other strings we sometimes see are HTTP 500, when the handler answered and chose to fail (usually because it's checking a downstream dep it shouldn't be), and connection refused, when the listener isn't up yet (usually no startup probe, app being polled before it's ready).
When the per-pod events don't make it obvious, we run kubectl get events --field-selector reason=Unhealthy -A and look at the cluster-wide picture. A deployment where every pod is failing the same way at the same time points at a shared dependency the pods are talking to, not at any one pod's process - that was the Postgres-vacuum incident I described above, and we've watched the same shape play out at least three more times since.
When the kubelet's events aren't conclusive, we exec into one of the failing pods and curl the probe endpoint from inside with our own timeout. If our curl returns 200 in 200ms while the kubelet's probe was timing out, the issue is either timeoutSeconds set too tight or something on the path between kubelet and pod that doesn't show up in app metrics - we've debugged a conntrack table fill that looked exactly like this.
If our curl reproduces the slowness, the handler is the problem and we go read the handler code.
Links
What our review process started rejecting
The patterns we now reject in probe-config review, drawn from the incidents we've actually had:
Anything liveness-related that touches a network dependency outside the process. The second incident I described above was exactly this shape - our
/healthzwas talking to Postgres, Postgres got slow, the whole deployment restarted. Liveness has to live inside the process's address space. Readiness can check downstream deps if we want to gate traffic on them, because readiness failing is recoverable without a restart.Same endpoint for liveness and readiness. They're answering different questions and serving them off the same path means we'll get restarts caused by downstream issues we never intended to restart for. The split is two extra YAML lines per Deployment and we've never regretted it.
JVM service without a startup probe. The default
initialDelaySecondswas tuned for a much faster era of Java; the Spring Boot apps we ship boot in tens of seconds on a good day and minutes on a bad one, so we've standardised on startup probe withfailureThreshold: 30, periodSeconds: 5across the JVM fleet.execprobes whenhttpGetwould do. We don't reject these on principle, but the reviewer has to be convinced the check can't reasonably be exposed over HTTP from inside the same process. The 90-pods-per-node episode burned us once and we'd rather not repeat it.timeoutSeconds: 1on a handler whose p99 is above 700ms. The default is one second and we've found the default is wrong for most real services - it leaves no headroom for the kinds of slow days the probe is supposed to tolerate. We set the timeout to p99 plus a comfortable buffer, not a round number that looked nice in the original copy-paste.Background workers with no probes at all. A queue consumer that wedges on a poisoned message stays wedged until someone notices it from the consumer-lag dashboard, which has historically been a customer complaint several hours late. A liveness probe pointed at a process-internal "am I still making progress" counter catches it inside one probe cycle, and that's what we now require on anything queue-driven.
Pod start was the quietest performance bug. Pod shutdown was the quietest correctness bug. The probe loop between them is both - quietly restarting healthy apps, silently failing readiness on unhealthy ones, until someone sits down with kubectl describe pod and reads what the kubelet has been saying out loud the entire time.
The sprint we spent on probe configs across the top ten deployments paid back the next quarter in fewer pages, smaller 5xx bands during incidents, and the deletion of three "auto-remediation" runbooks that turned out to be unnecessary once the probes were doing what we'd intended them to do.
- Ilia